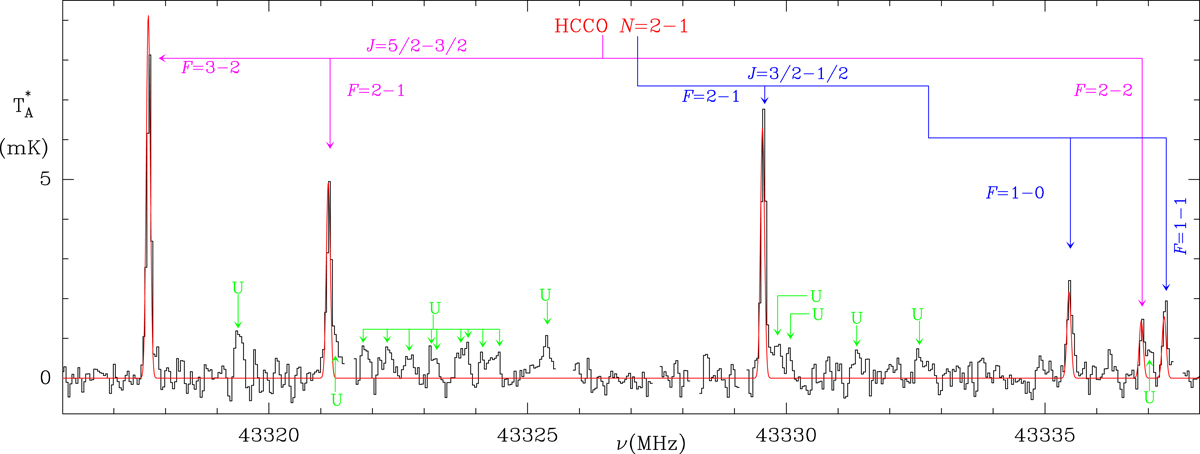
Fig. B.2.
Download original image
Observed lines of the 202 − 101 transition of HCCO in TMC-1. The abscissa corresponds to the rest frequency of the lines. The vLSR, linewidth, and integrated intensity of each line are given in Table A.1. The ordinate is the antenna temperature, corrected for atmospheric and telescope losses, in milli Kelvin. The noise of this spectrum is 0.22 mK. The quantum numbers for each transition are indicated. The hyperfine components of the fine structure transitions J = 5/2-3/2 and J = 3/2-1/2 are indicated in violet and blue, respectively. The red line shows the computed synthetic spectrum for this species (see Appendix B.2). Blank channels correspond to negative features produced in the folding of the frequency switching data.
Current usage metrics show cumulative count of Article Views (full-text article views including HTML views, PDF and ePub downloads, according to the available data) and Abstracts Views on Vision4Press platform.
Data correspond to usage on the plateform after 2015. The current usage metrics is available 48-96 hours after online publication and is updated daily on week days.
Initial download of the metrics may take a while.