Free Access
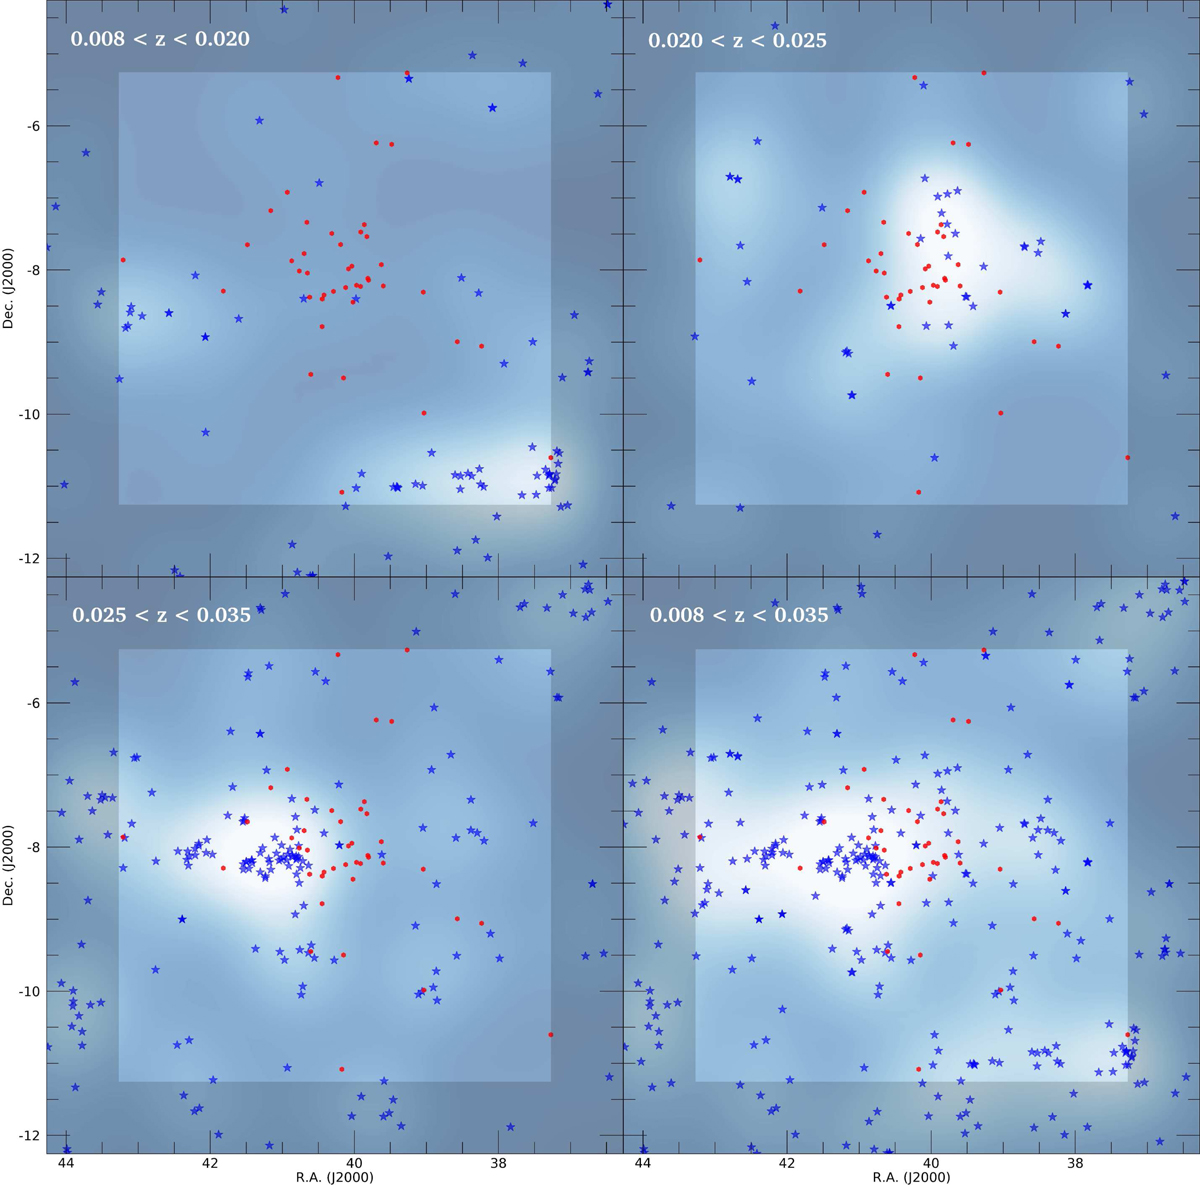
Fig. 9.
Download original image
Similar plot to that of Fig. 8 but in different redshift intervals corresponding to overdensities in the background of the NGC 1052 environment, for each panel. We note that the bottom right panel (0.008 < z < 0.035) is the cumulative of the other three panels.
Current usage metrics show cumulative count of Article Views (full-text article views including HTML views, PDF and ePub downloads, according to the available data) and Abstracts Views on Vision4Press platform.
Data correspond to usage on the plateform after 2015. The current usage metrics is available 48-96 hours after online publication and is updated daily on week days.
Initial download of the metrics may take a while.