Fig. 11.
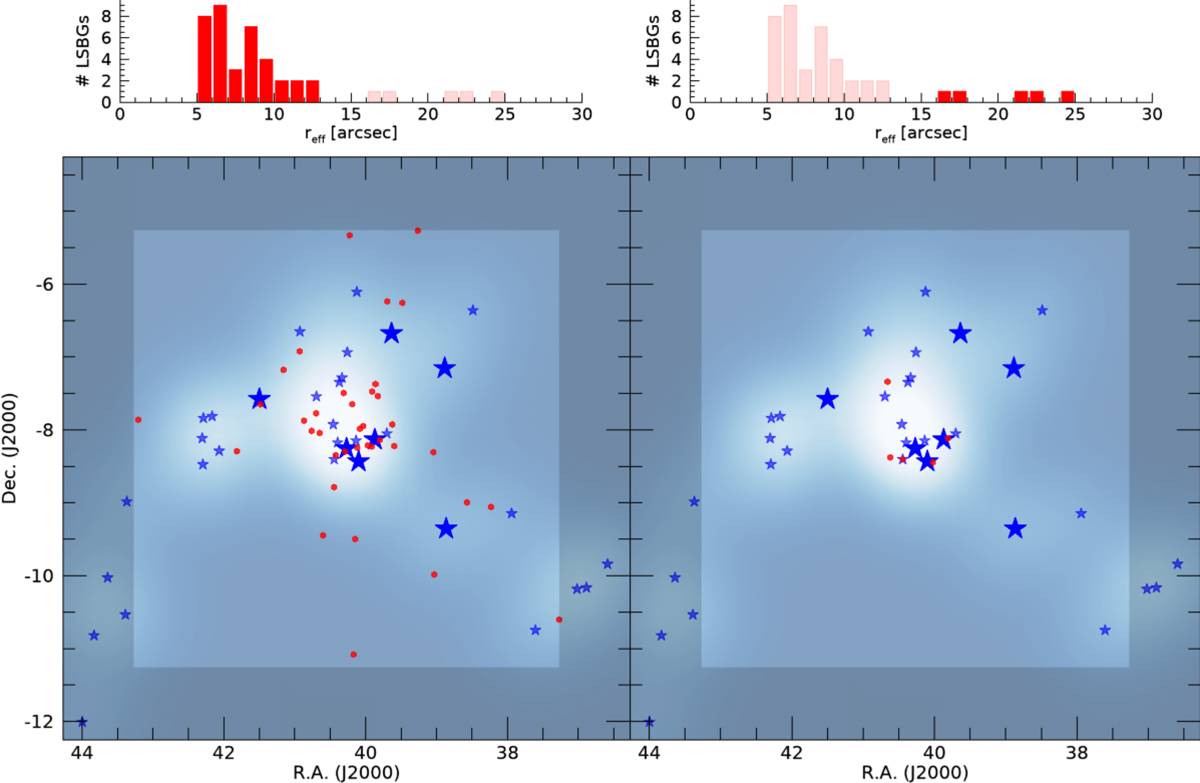
Download original image
Spatial distribution of LSBGs and galaxies with spectroscopic measurements at 0.003 < z < 0.008, similar to that of Fig. 8. Here, LSBGs are plotted separately with reff < 15 arcsec (left panel) and reff > 15 arcsec (right panel). In the upper part of both panels, the distribution of effective radii of the LSBGs is presented with dark red for the galaxies plotted in their lower panel and light red for the hidden ones.
Current usage metrics show cumulative count of Article Views (full-text article views including HTML views, PDF and ePub downloads, according to the available data) and Abstracts Views on Vision4Press platform.
Data correspond to usage on the plateform after 2015. The current usage metrics is available 48-96 hours after online publication and is updated daily on week days.
Initial download of the metrics may take a while.