Fig. 7
Download original image
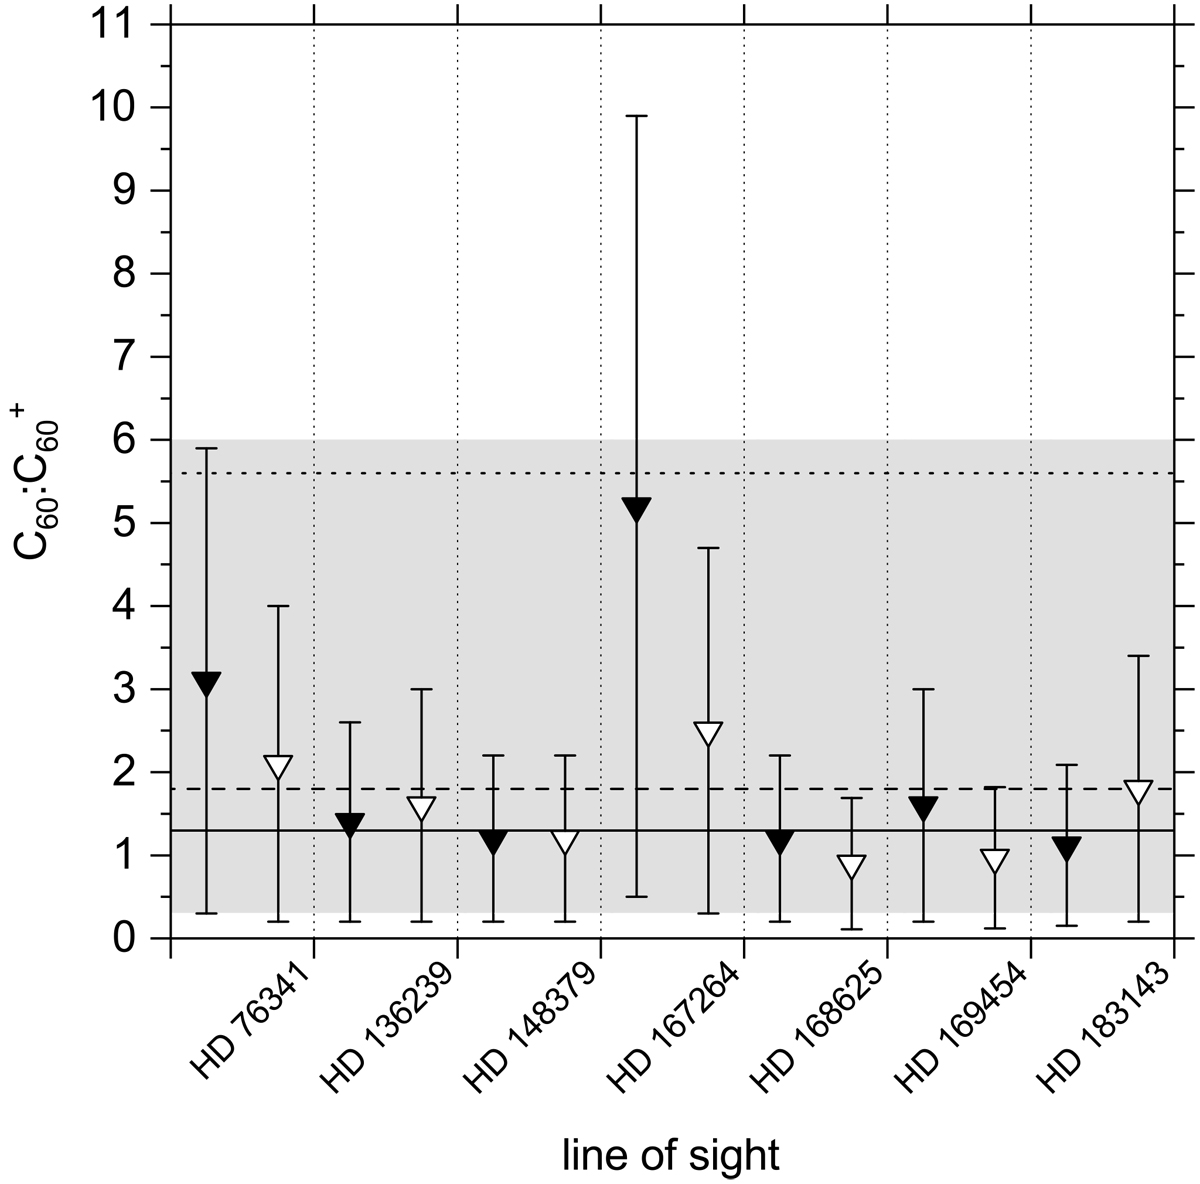
Values of C60:C![]() in the diffuse ISM as a function of LOS (see Table 3). Triangle symbols (▾ and ▿): upper limits uN(C60, γ0)/N(C
in the diffuse ISM as a function of LOS (see Table 3). Triangle symbols (▾ and ▿): upper limits uN(C60, γ0)/N(C![]() , λ) with λ = 9577.5 Å and λ = 9632.7 Å, respectively. Error bars correspond to errors given in Table 3. Gray area: C60:C
, λ) with λ = 9577.5 Å and λ = 9632.7 Å, respectively. Error bars correspond to errors given in Table 3. Gray area: C60:C![]() according to Berné et al. (2017). Horizontal dotted line: C60:C
according to Berné et al. (2017). Horizontal dotted line: C60:C![]() for a typical diffuse medium as derived by Bakes & Tielens (1995). Horizontal dashed line: mean value of the present upper limits. Horizontal solid line: weighted mean value of the present upper limits. Vertical dotted lines separate the data relevant to each LOS.
for a typical diffuse medium as derived by Bakes & Tielens (1995). Horizontal dashed line: mean value of the present upper limits. Horizontal solid line: weighted mean value of the present upper limits. Vertical dotted lines separate the data relevant to each LOS.
Current usage metrics show cumulative count of Article Views (full-text article views including HTML views, PDF and ePub downloads, according to the available data) and Abstracts Views on Vision4Press platform.
Data correspond to usage on the plateform after 2015. The current usage metrics is available 48-96 hours after online publication and is updated daily on week days.
Initial download of the metrics may take a while.