Open Access
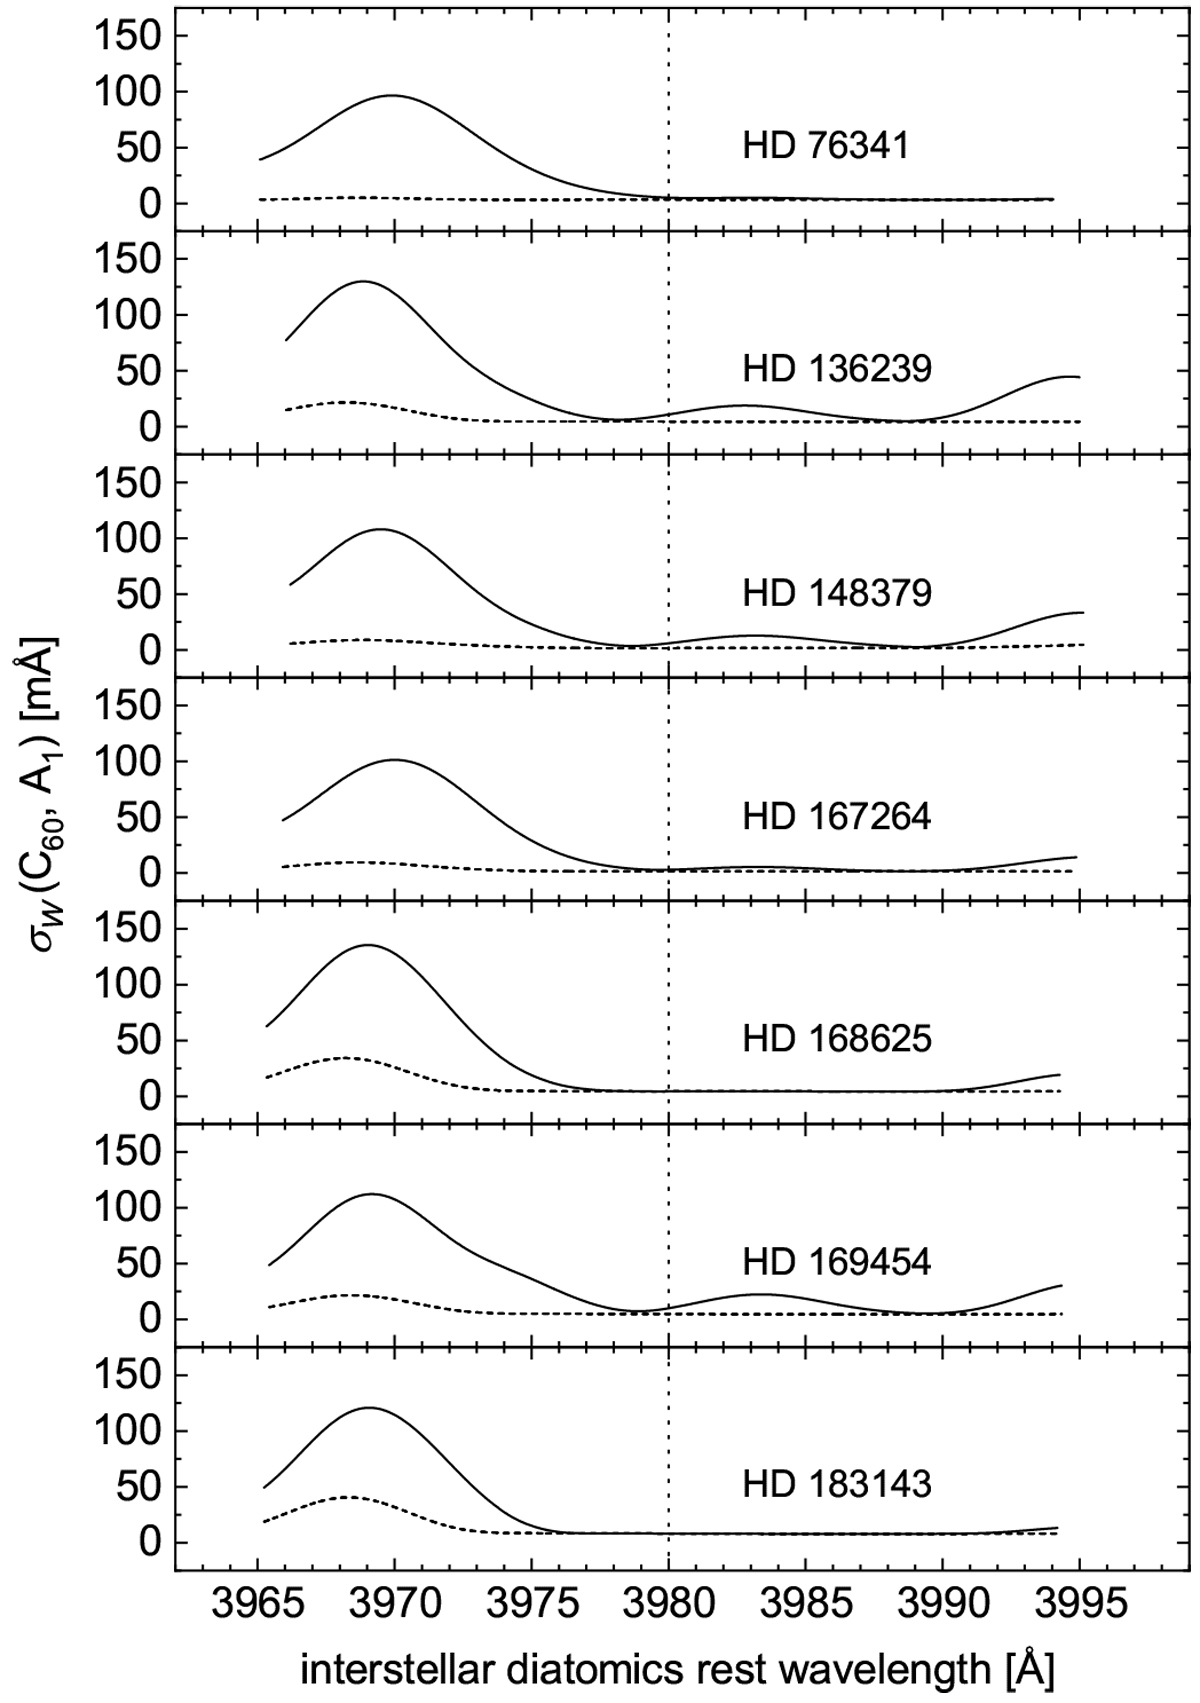
Fig. 6
Download original image
Equivalent-width detection threshold in the 4000 Å region scale for seven LOSs (solid curves). The vertical dotted line shows the expected position of the near-UV band of C60 in all spectra. The detection limits were also computed as fitted profiles of stellar lines were included in the continuum (short-dashed curves).
Current usage metrics show cumulative count of Article Views (full-text article views including HTML views, PDF and ePub downloads, according to the available data) and Abstracts Views on Vision4Press platform.
Data correspond to usage on the plateform after 2015. The current usage metrics is available 48-96 hours after online publication and is updated daily on week days.
Initial download of the metrics may take a while.