Open Access
Fig. 2
Download original image
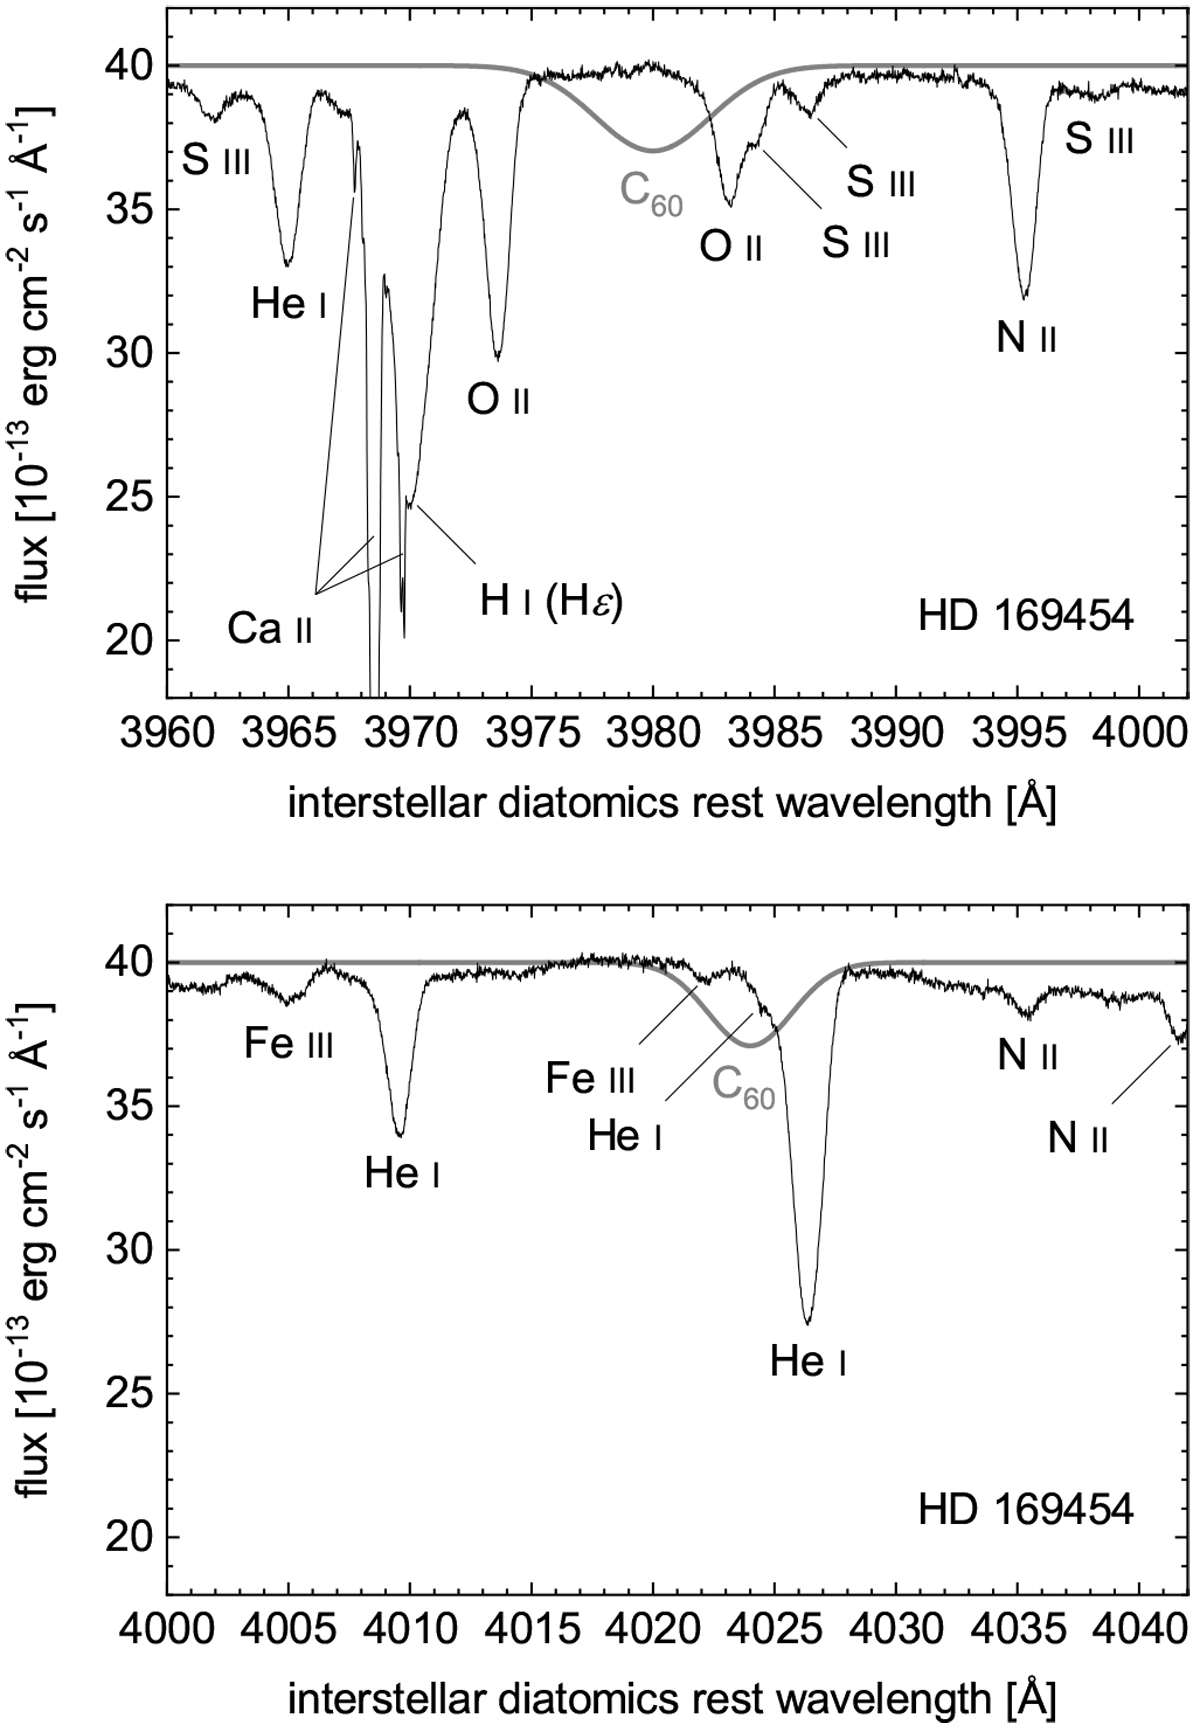
Spectrum toward HD 169454 (black solid curve) and synthetic absorption spectrum of C60 with the expected band positions, widths, and relative areas (thick gray solid curve). Narrow absorption lines in the 3967–3971 Å interval correspond to velocity components of the Ca II H line.
Current usage metrics show cumulative count of Article Views (full-text article views including HTML views, PDF and ePub downloads, according to the available data) and Abstracts Views on Vision4Press platform.
Data correspond to usage on the plateform after 2015. The current usage metrics is available 48-96 hours after online publication and is updated daily on week days.
Initial download of the metrics may take a while.