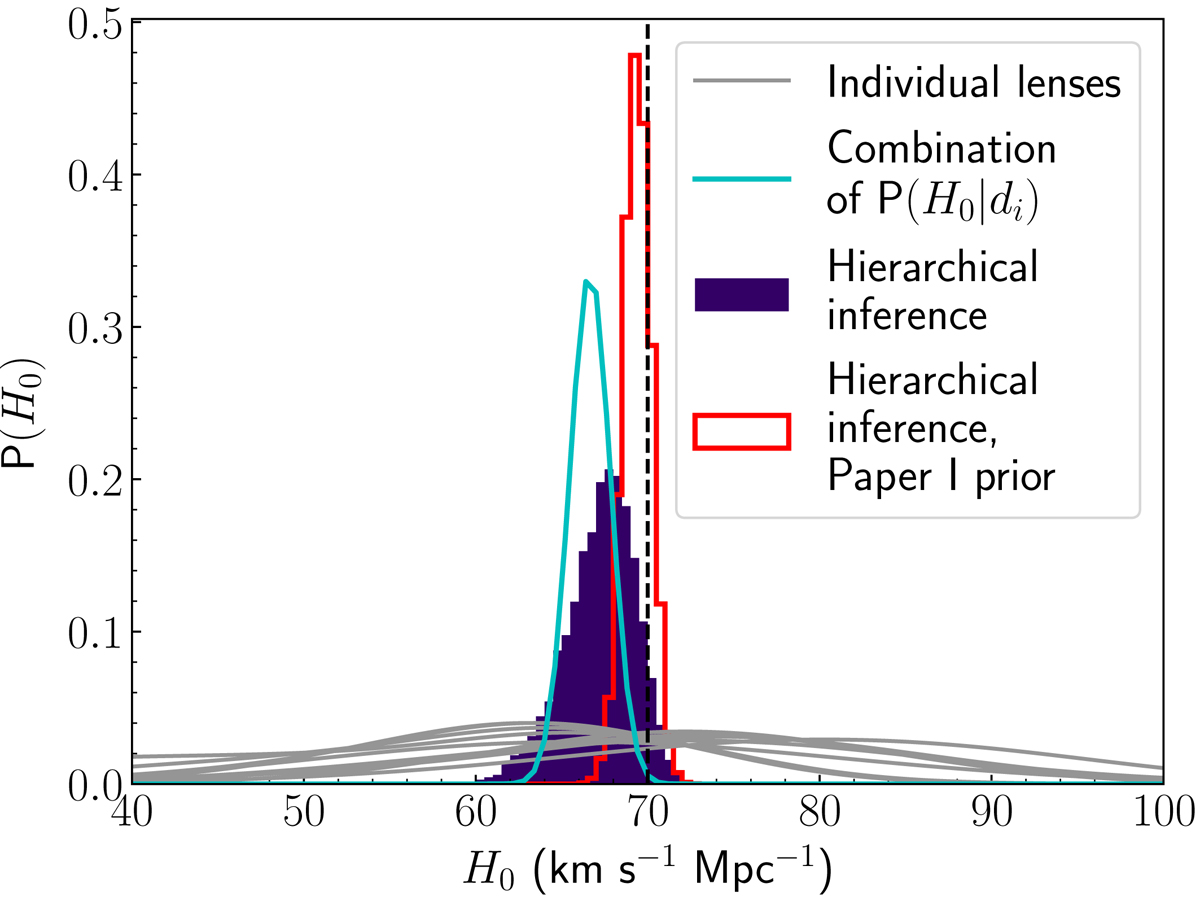
Fig. 3.
Download original image
Marginal posterior probability on H0. Grey curves: Individual lens P(H0|di) obtained from Eq. (25) assuming flat priors on the lens model parameters, for ten time-delay lenses. Cyan curve: Statistical combination of the marginal posterior probabilities from the 100 time-delay lenses obtained following Eq. (26). Filled purple histogram: Hierarchical inference from Sect. 5.1 Red histogram: Hierarchical inference with a prior from Paper I, from Sect. 5.2. The vertical dashed line marks the true value of H0 used to simulate the data.
Current usage metrics show cumulative count of Article Views (full-text article views including HTML views, PDF and ePub downloads, according to the available data) and Abstracts Views on Vision4Press platform.
Data correspond to usage on the plateform after 2015. The current usage metrics is available 48-96 hours after online publication and is updated daily on week days.
Initial download of the metrics may take a while.