Fig. 2.
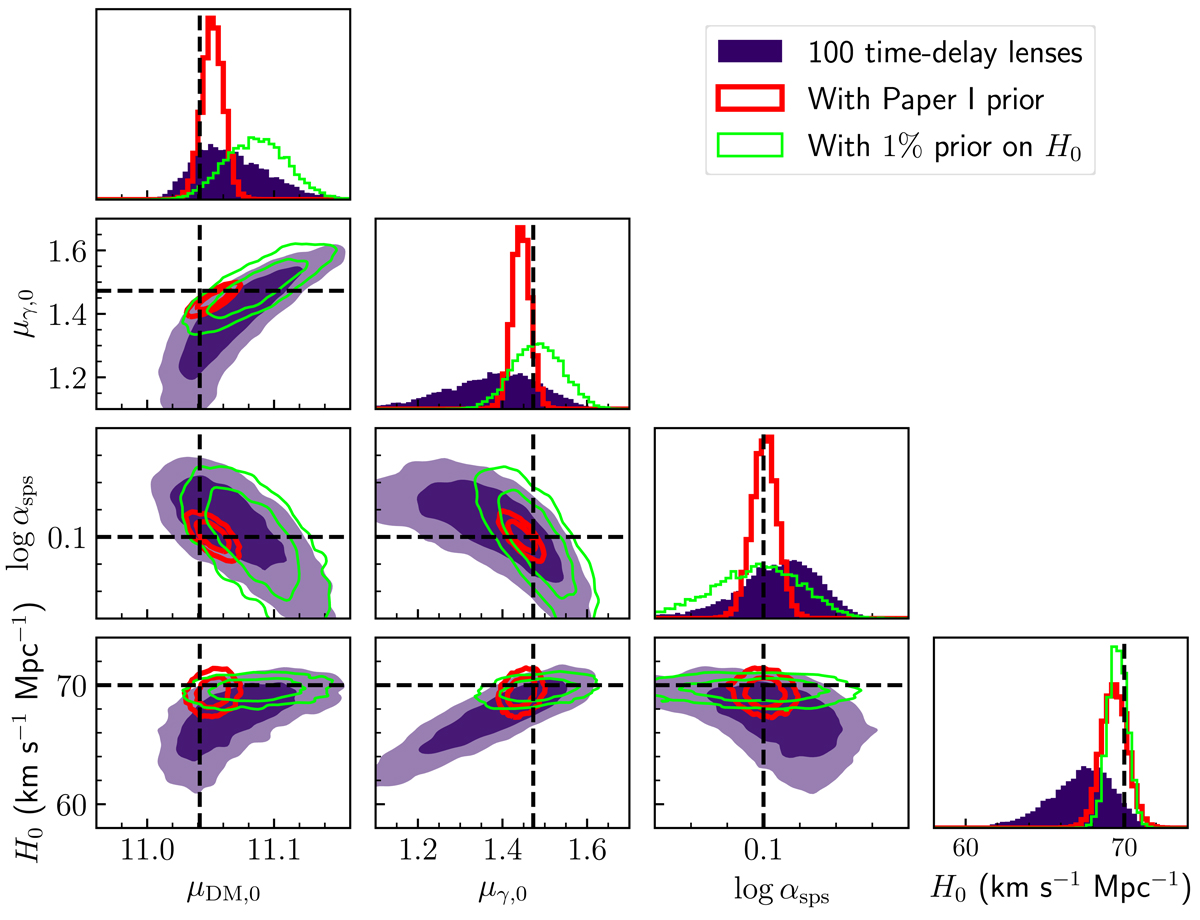
Download original image
Posterior probability distribution of the four key parameters of the model: the Hubble constant, the stellar population synthesis mismatch parameter, the average log MDM, 5, and the average γDM. Purple filled contours correspond to the fit to the sample of 100 time-delay lenses, with no extra information. Red lines show the posterior probability obtained by using prior information on the model parameters from the sample of 1000 strong lenses simulated in Paper I. Contour levels correspond to 68% and 95% enclosed probability regions. Dashed lines indicate the true values of the parameters, which are defined by fitting the model directly to the distribution of log MDM, 5, γDM, and log αsps of the mock sample.
Current usage metrics show cumulative count of Article Views (full-text article views including HTML views, PDF and ePub downloads, according to the available data) and Abstracts Views on Vision4Press platform.
Data correspond to usage on the plateform after 2015. The current usage metrics is available 48-96 hours after online publication and is updated daily on week days.
Initial download of the metrics may take a while.