Free Access
Fig. 3
Download original image
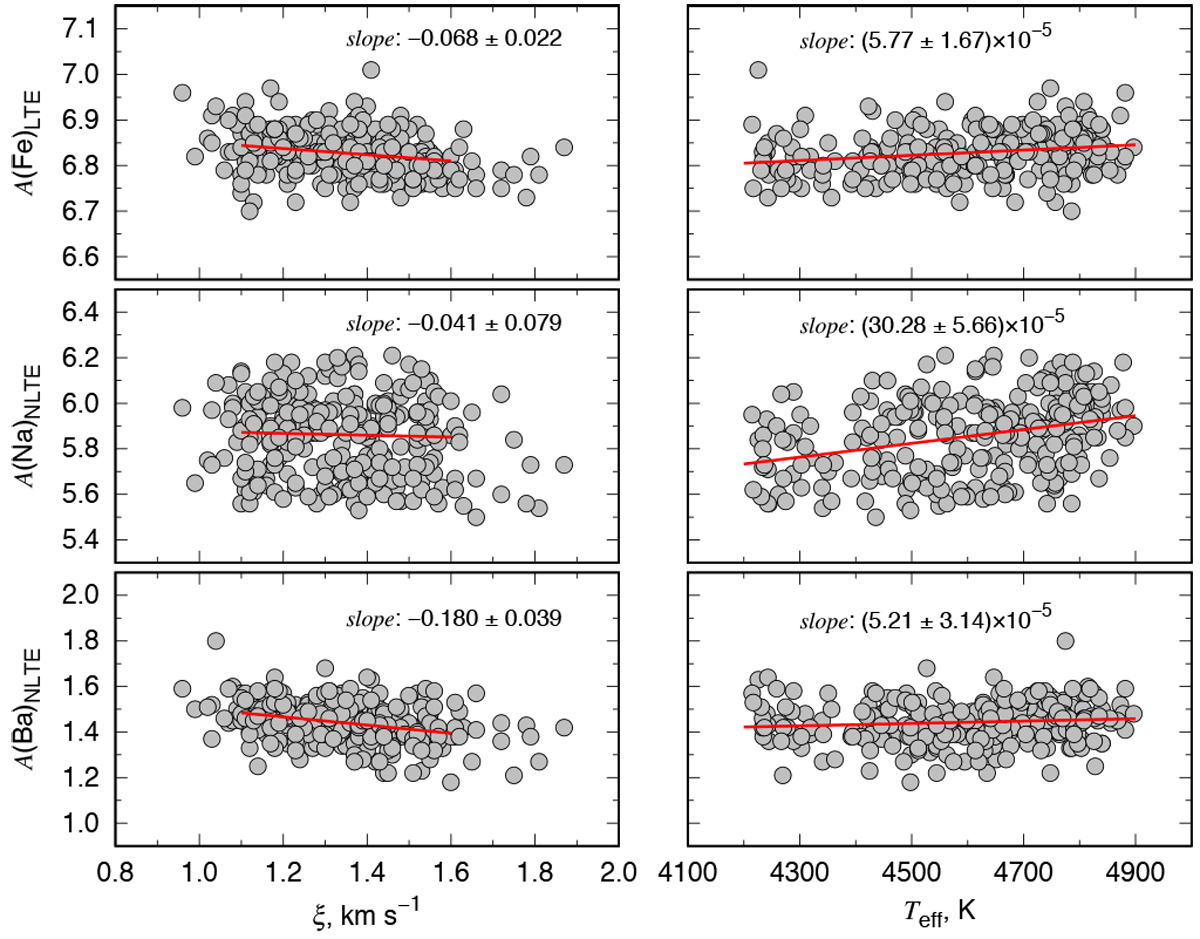
Fe (top row), Na (middle row), and Ba (bottom row) abundances plotted against the microturbulence velocity (left column) and effective temperature (right column). In all panels, the linear fits to the data are shown as the solid red lines.
Current usage metrics show cumulative count of Article Views (full-text article views including HTML views, PDF and ePub downloads, according to the available data) and Abstracts Views on Vision4Press platform.
Data correspond to usage on the plateform after 2015. The current usage metrics is available 48-96 hours after online publication and is updated daily on week days.
Initial download of the metrics may take a while.