Free Access
Fig. 2
Download original image
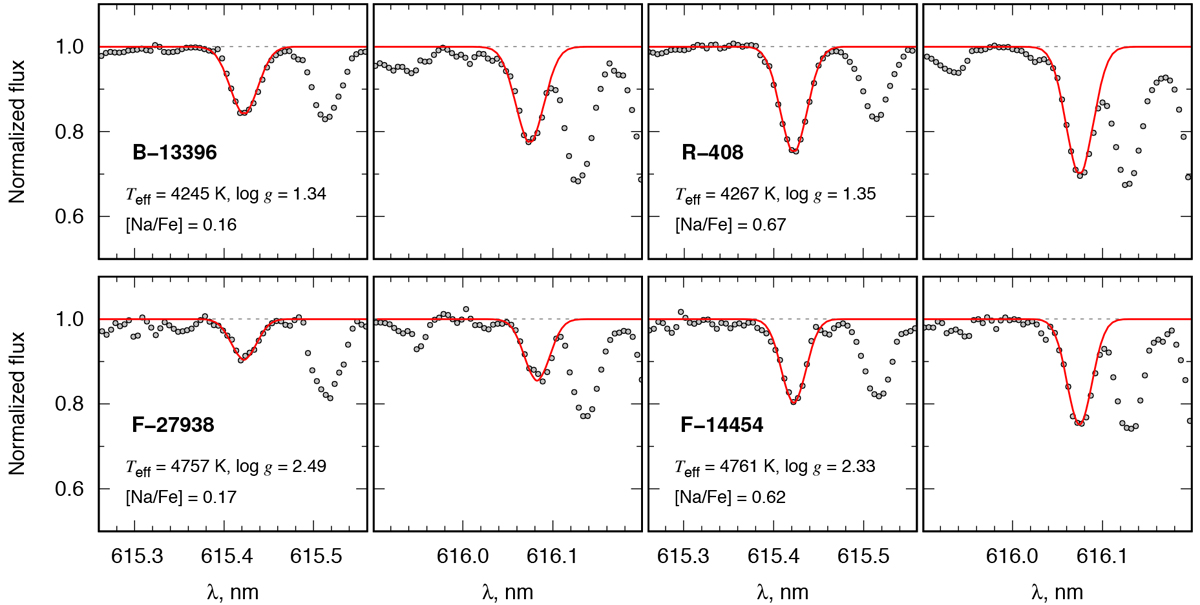
Examples of the observed (black dots) and best-fitted synthetic Na I line profiles (red lines) in the GIRAFFE spectra of the target stars characterised by different Na abundances and effective temperatures (Teff ≈ 4250 K, top row; Teff ≈ 4750 K, bottom row). The continuum level is shown as the gray dashed line.
Current usage metrics show cumulative count of Article Views (full-text article views including HTML views, PDF and ePub downloads, according to the available data) and Abstracts Views on Vision4Press platform.
Data correspond to usage on the plateform after 2015. The current usage metrics is available 48-96 hours after online publication and is updated daily on week days.
Initial download of the metrics may take a while.