Free Access
Fig. 8
Download original image
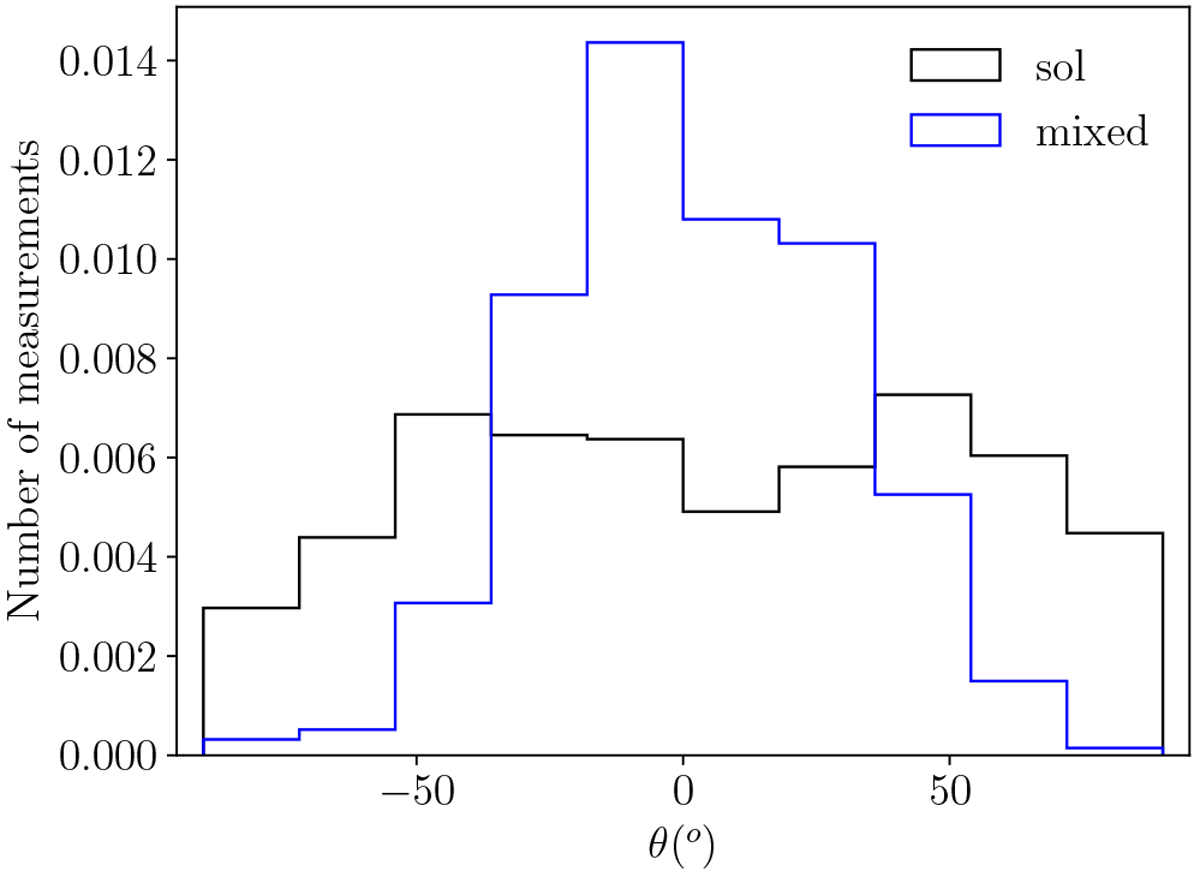
Polarization angle distributions for two different simulations with MA = 2.0 and Ms = 2.0. Black histogram corresponds to solenoidally driven cloud, while the blue to mixed forcing. Both histograms are normalized by dividing each bin with the total number of measurements. The legend shows the type of forcing.
Current usage metrics show cumulative count of Article Views (full-text article views including HTML views, PDF and ePub downloads, according to the available data) and Abstracts Views on Vision4Press platform.
Data correspond to usage on the plateform after 2015. The current usage metrics is available 48-96 hours after online publication and is updated daily on week days.
Initial download of the metrics may take a while.