Fig. 4
Download original image
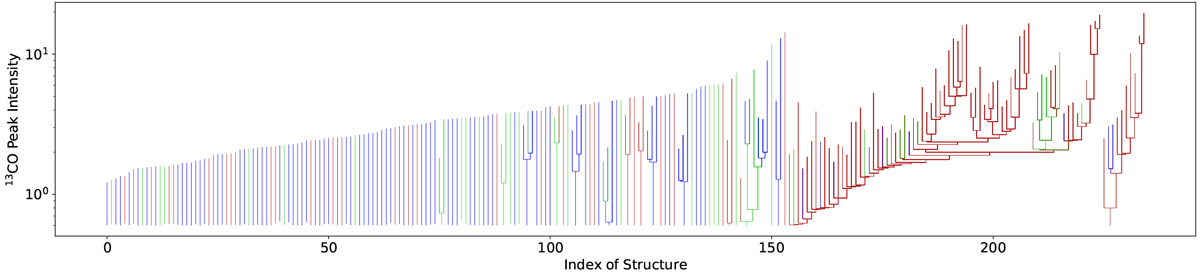
Dendrogram of G305 on 13CO spectral cube. The structures that show greater than ~67% overlap with the 8 μm mask (regions with 8 μm flux greater than 100 MJy sr−1 representing molecular gas influenced by feedback from the central star clusters in G305) are colored red; those with partial overlap (between 10–67%) are colored green; and the structures with less than 10% overlap with the 8 μm mask are colored blue.
Current usage metrics show cumulative count of Article Views (full-text article views including HTML views, PDF and ePub downloads, according to the available data) and Abstracts Views on Vision4Press platform.
Data correspond to usage on the plateform after 2015. The current usage metrics is available 48-96 hours after online publication and is updated daily on week days.
Initial download of the metrics may take a while.