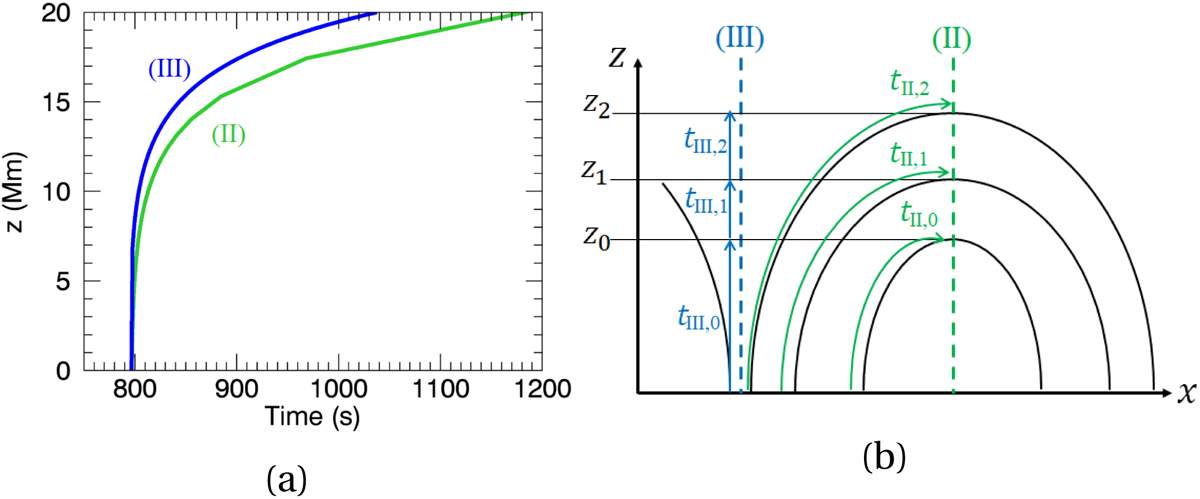
Fig. 8.
Download original image
As the lines seen in Fig. 7 now illustrated in panel a along with (b) an illustration of how they are calculated. The black lines depict the arcades structure. For each height zi, tII, i and tIII, i denote the time it takes from z = 0 to reach that height on slits (II: green dashed line) and (III: blue dashed line), respectively.
Current usage metrics show cumulative count of Article Views (full-text article views including HTML views, PDF and ePub downloads, according to the available data) and Abstracts Views on Vision4Press platform.
Data correspond to usage on the plateform after 2015. The current usage metrics is available 48-96 hours after online publication and is updated daily on week days.
Initial download of the metrics may take a while.