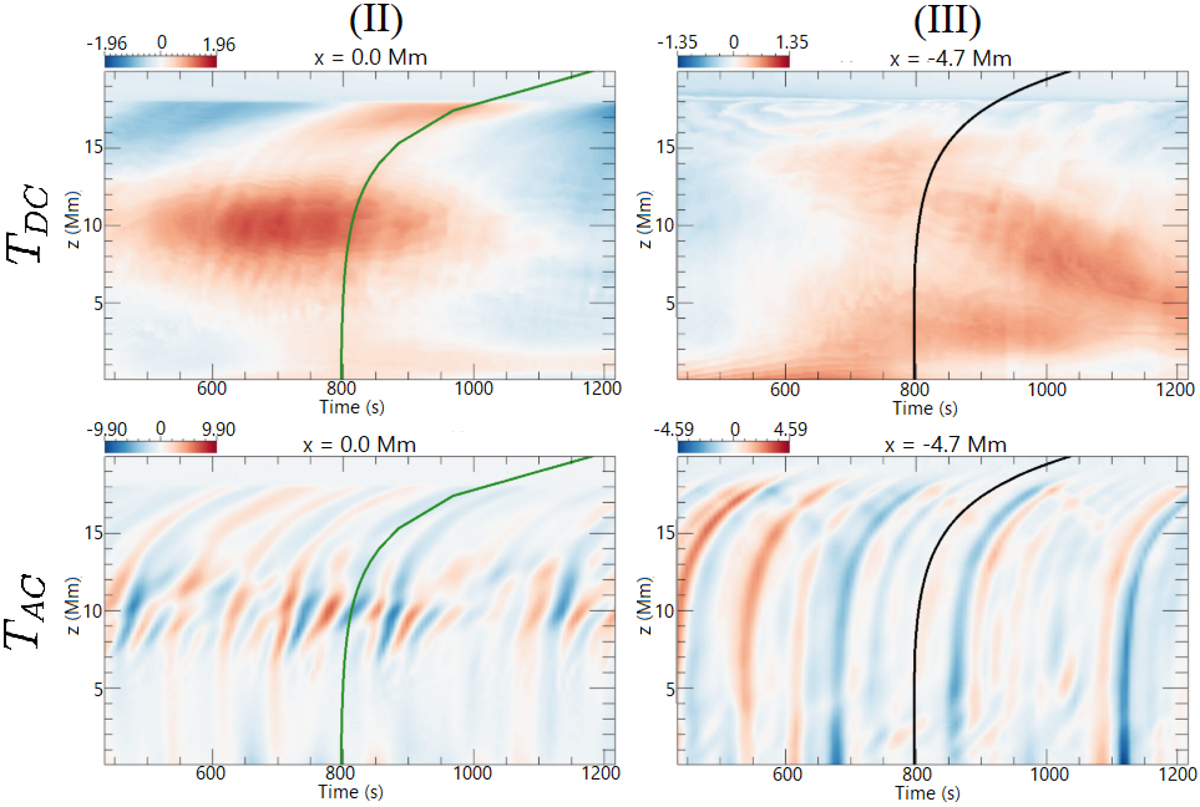
Fig. 7.
Download original image
As panels II (through the apex) and III (between arcades) in Fig. 6 for the τDC (top row) and τAC (bottom row) simulations with a truncated time axis between approximately 450 s and 1200 s. The solid lines are the expected signatures of an Alfvén wave excited on the lower boundary at approximately t = 800 s. These are calculated along a single magnetic field line (black: right hand panels) and taking multiple magnetic field lines into account (green: left hand panels).
Current usage metrics show cumulative count of Article Views (full-text article views including HTML views, PDF and ePub downloads, according to the available data) and Abstracts Views on Vision4Press platform.
Data correspond to usage on the plateform after 2015. The current usage metrics is available 48-96 hours after online publication and is updated daily on week days.
Initial download of the metrics may take a while.