Free Access
Fig. 6.
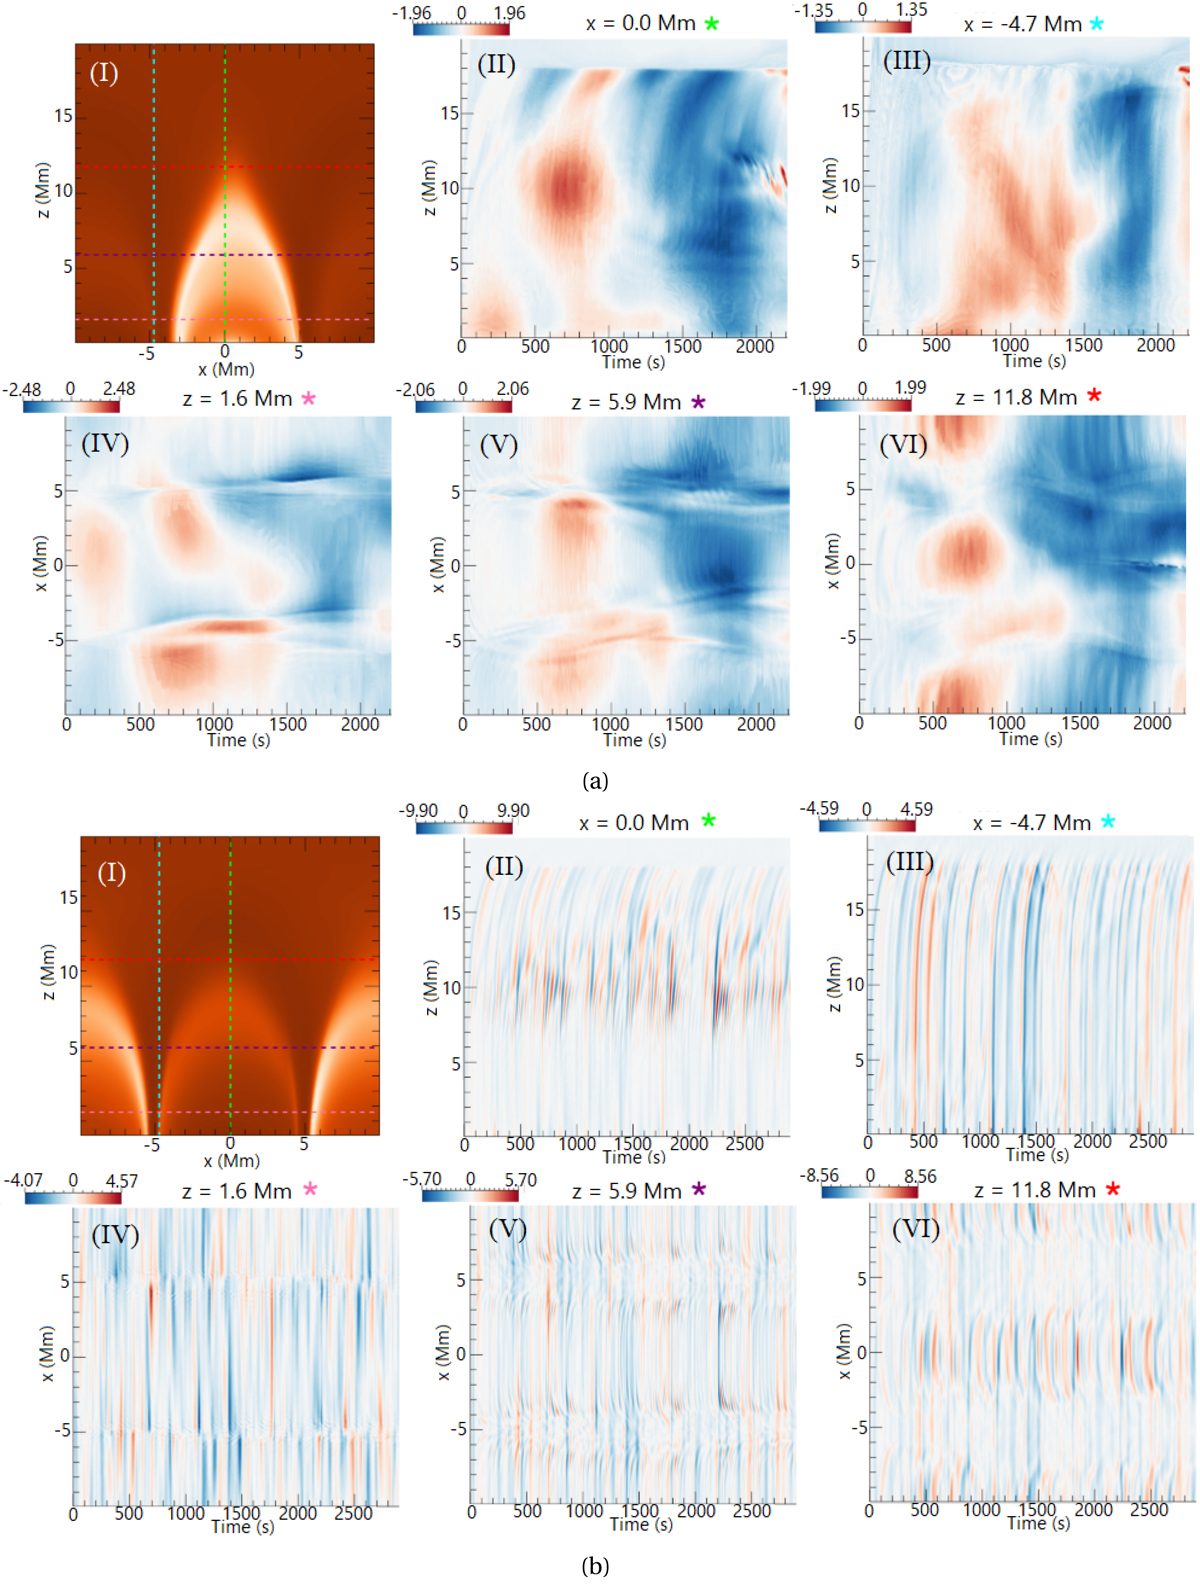
Download original image
Doppler velocity for Fe XII along various slits as a function of time in the ideal (a) τDC and (b) τAC simulations in km s−1 in panels II–VI. The slits are colour coded in the synthetic total intensity figure in panel I.
Current usage metrics show cumulative count of Article Views (full-text article views including HTML views, PDF and ePub downloads, according to the available data) and Abstracts Views on Vision4Press platform.
Data correspond to usage on the plateform after 2015. The current usage metrics is available 48-96 hours after online publication and is updated daily on week days.
Initial download of the metrics may take a while.