Fig. 4.
Download original image
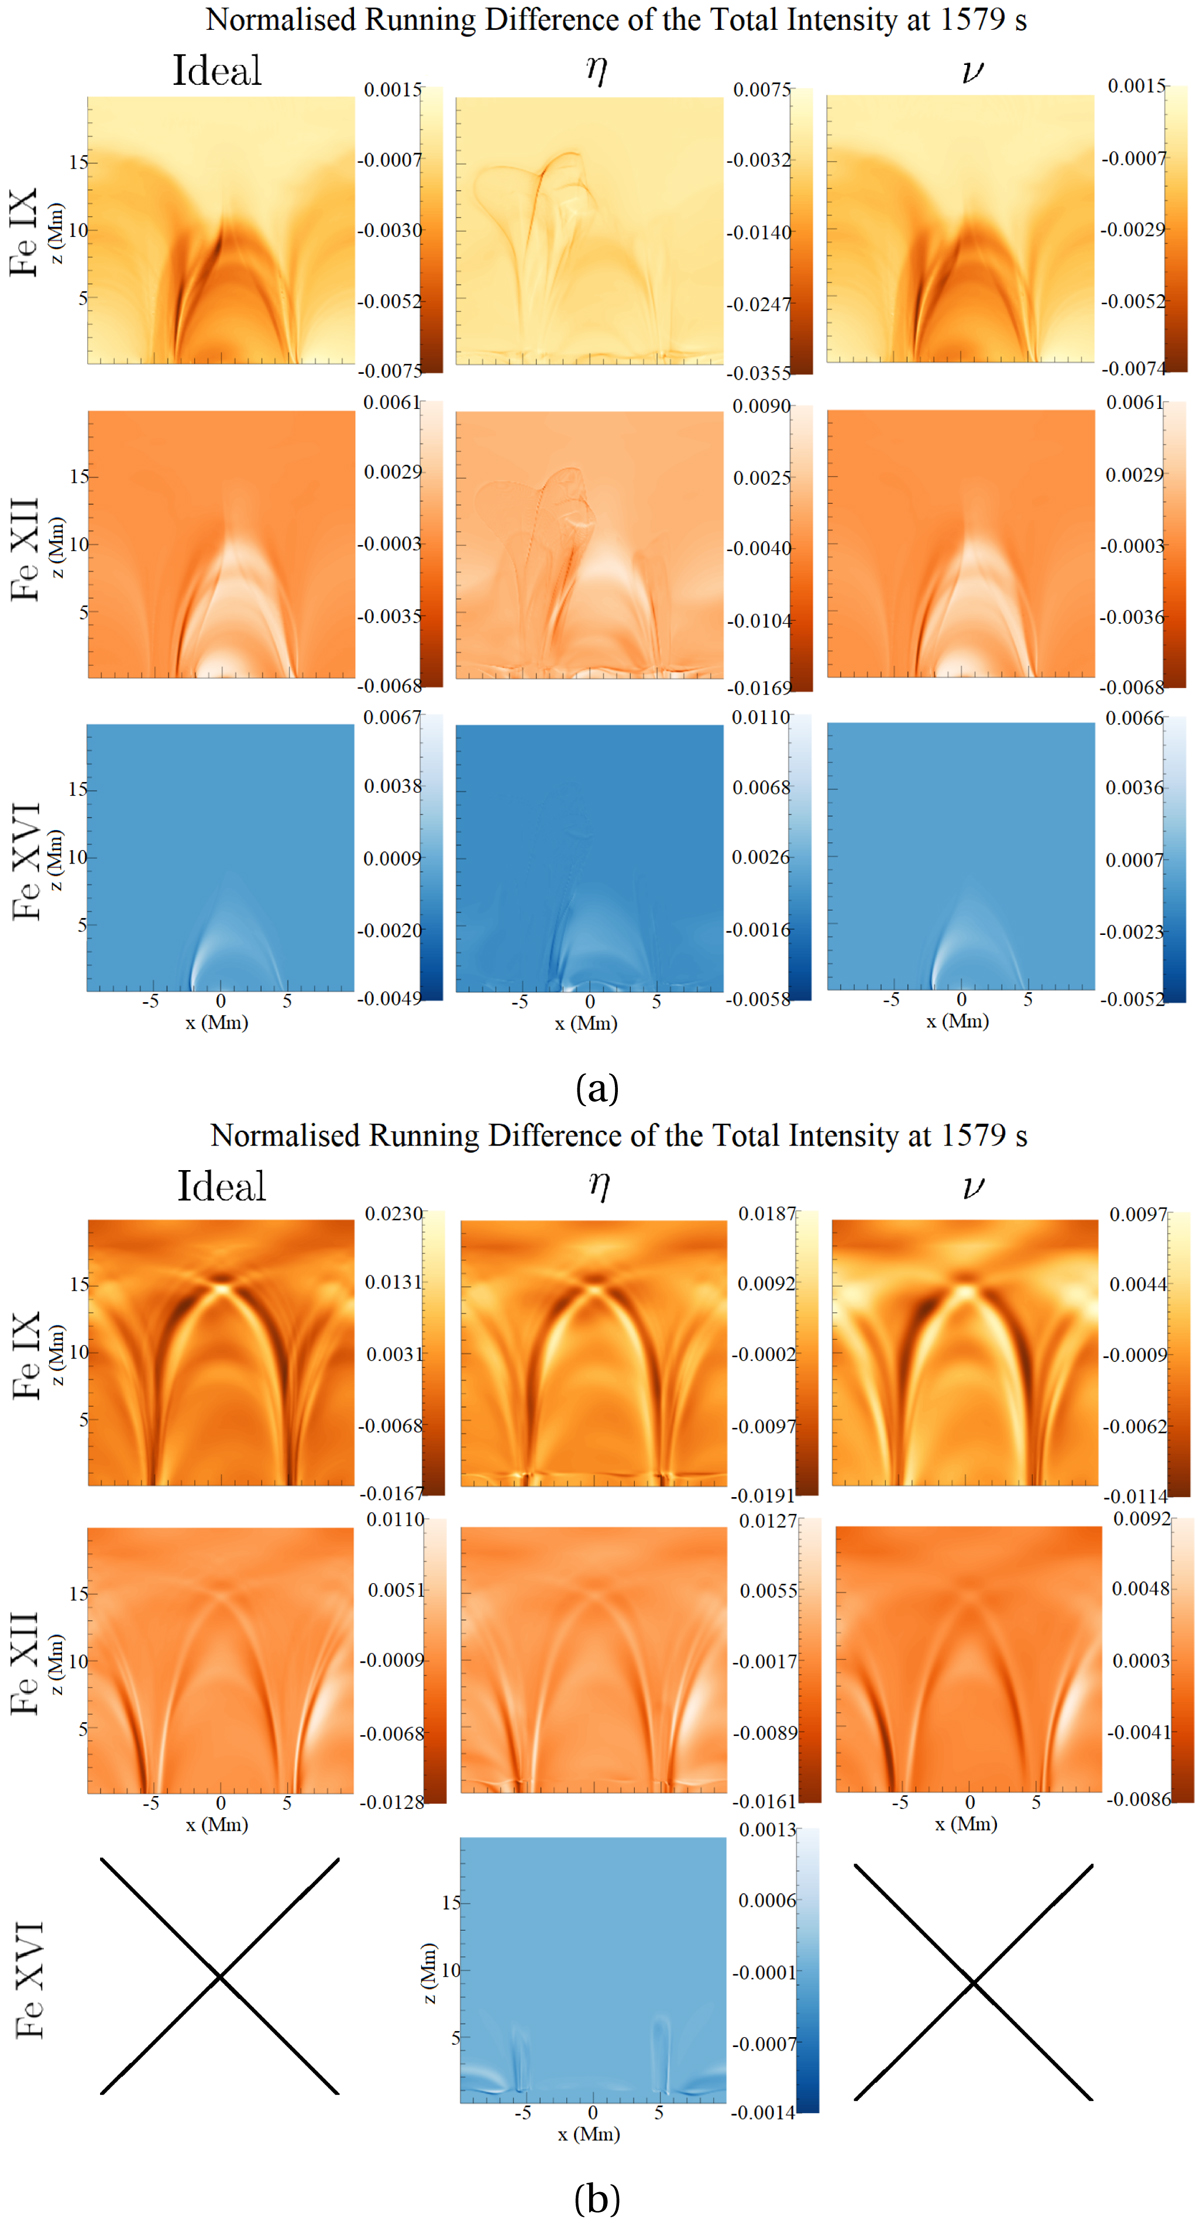
Running difference (cadence of 7.2 s) of the normalised synthetic total intensity at 1579 s in Fe IX (row 1), Fe XII (row 2), and Fe XVI (row 3) for the ideal (Col. 1), resistive (Col. 2), and viscous (Col. 3) simulations using the (a) τDC and (b) τAC boundary drivers. Normalisation and neglected panels are as described in Fig. 3.
Current usage metrics show cumulative count of Article Views (full-text article views including HTML views, PDF and ePub downloads, according to the available data) and Abstracts Views on Vision4Press platform.
Data correspond to usage on the plateform after 2015. The current usage metrics is available 48-96 hours after online publication and is updated daily on week days.
Initial download of the metrics may take a while.