Fig. 16.
Download original image
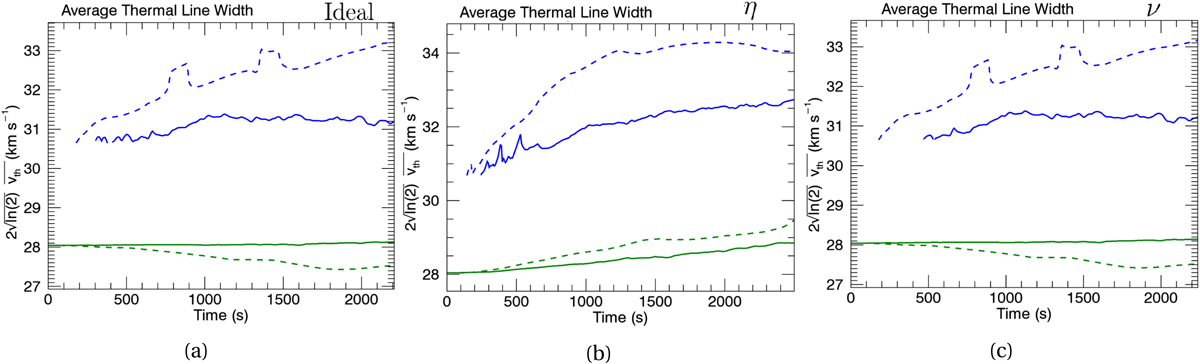
Average estimated thermal line width (![]() ) as a function of time during the τDC (dashed line) and τAC (solid line) simulations in the ideal (left panel), resistive (middle panel) and viscous (right panel) regimes. Emission lines Fe IX (green) and Fe XII (blue) are examined. It should be noted that the multiplication of
) as a function of time during the τDC (dashed line) and τAC (solid line) simulations in the ideal (left panel), resistive (middle panel) and viscous (right panel) regimes. Emission lines Fe IX (green) and Fe XII (blue) are examined. It should be noted that the multiplication of ![]() to allow for comparison with Fig. 15.
to allow for comparison with Fig. 15.
Current usage metrics show cumulative count of Article Views (full-text article views including HTML views, PDF and ePub downloads, according to the available data) and Abstracts Views on Vision4Press platform.
Data correspond to usage on the plateform after 2015. The current usage metrics is available 48-96 hours after online publication and is updated daily on week days.
Initial download of the metrics may take a while.