Free Access
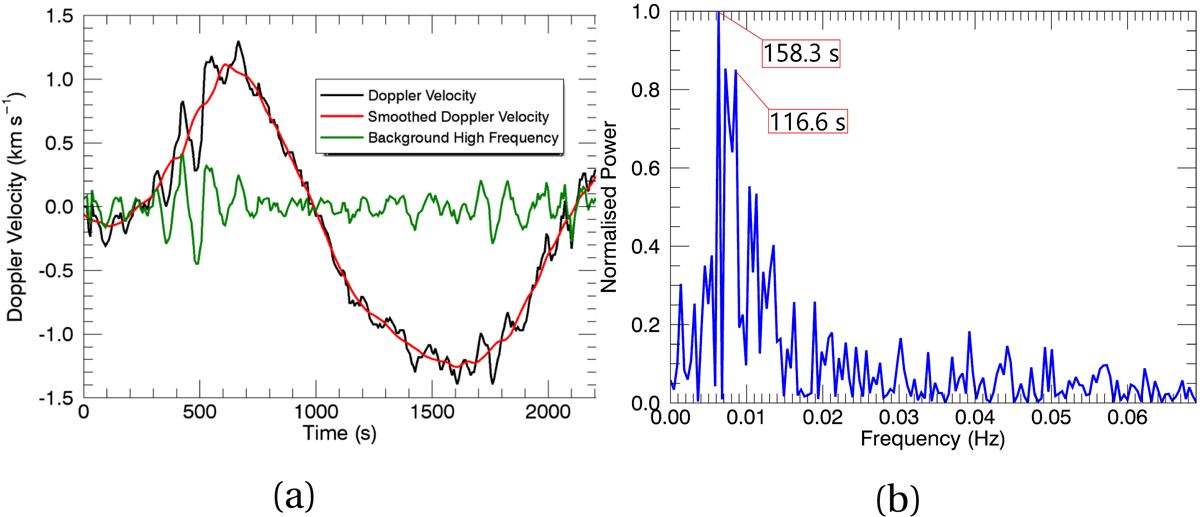
Fig. 10.
Download original image
Panel a: Doppler velocity (black) as a function of time at (x, z) = (−9.9, 11.8) Mm, along with a smoothed version of the Doppler velocity curve (red) and the difference between the Doppler velocity and the smoothed Doppler velocity (green). Panel b: corresponding FFT of the high frequency signal (green curve in panel a).
Current usage metrics show cumulative count of Article Views (full-text article views including HTML views, PDF and ePub downloads, according to the available data) and Abstracts Views on Vision4Press platform.
Data correspond to usage on the plateform after 2015. The current usage metrics is available 48-96 hours after online publication and is updated daily on week days.
Initial download of the metrics may take a while.