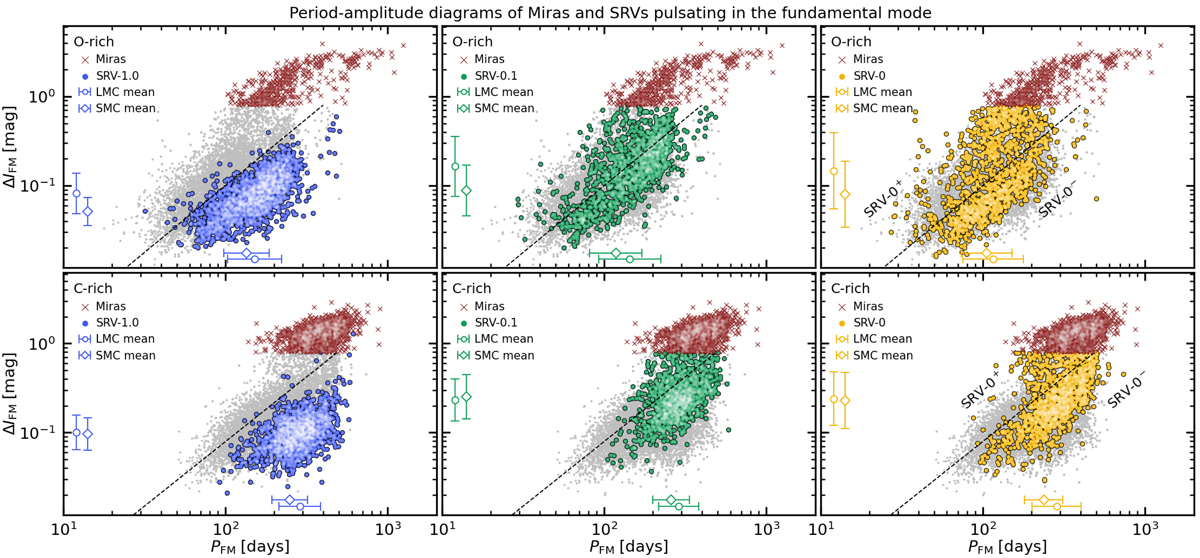
Fig. 5.
Download original image
Fundamental mode period–amplitude diagrams of SRVs (circles) and Miras (crosses). The former are colour-coded according to the group they are assigned to, i.e., SRV-1.0 (blue), SRV-0.1 (green), and SRV-0 (orange), which are displayed in panels on the left, central, and right columns, respectively. Grey dots in the background show all the periods in the sample for visual reference. Symbols near the sides of each panel indicate the mean period and amplitude for each group, distinguishing between the LMC (empty circles) and SMC (empty diamonds), while error bars trace the corresponding standard deviation (these statistics are computed on a logarithmic scale). Panels in the top and bottom row are limited, respectively, to O- and C-rich LPVs. Dashed lines are defined by Eq. (4).
Current usage metrics show cumulative count of Article Views (full-text article views including HTML views, PDF and ePub downloads, according to the available data) and Abstracts Views on Vision4Press platform.
Data correspond to usage on the plateform after 2015. The current usage metrics is available 48-96 hours after online publication and is updated daily on week days.
Initial download of the metrics may take a while.