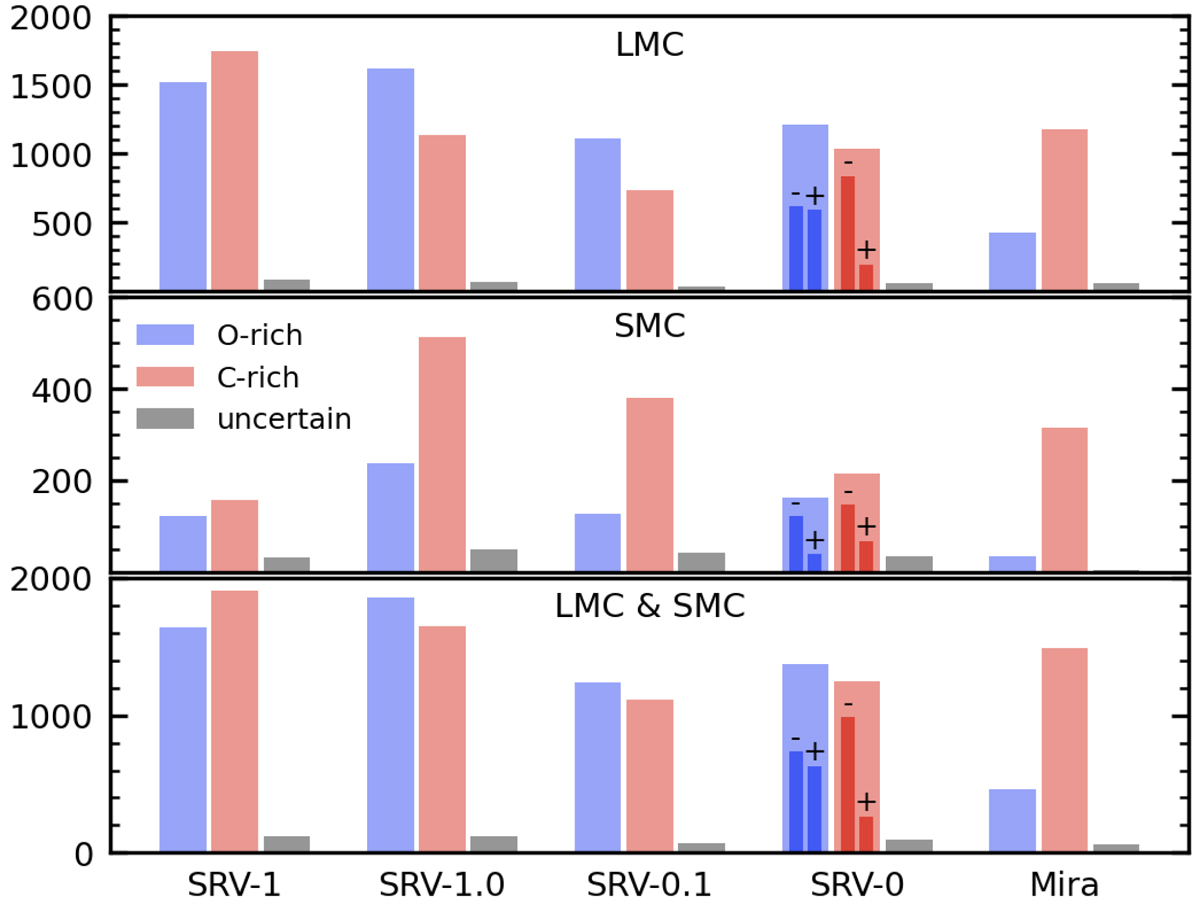
Fig. 4.
Download original image
Histograms for the data reported in Table 4. Panels from top to bottom: describe the LMC, SMC, and both. O- and C-rich sources are indicated by blue and red bars, respectively, while black bars correspond to sources whose chemical type is uncertain. Thin bars in the SRV-0 histograms indicate the subgroups SRV-0− and SRV-0+, which are introduced in Sect. 4.1.
Current usage metrics show cumulative count of Article Views (full-text article views including HTML views, PDF and ePub downloads, according to the available data) and Abstracts Views on Vision4Press platform.
Data correspond to usage on the plateform after 2015. The current usage metrics is available 48-96 hours after online publication and is updated daily on week days.
Initial download of the metrics may take a while.