Free Access
Fig. 3.
Download original image
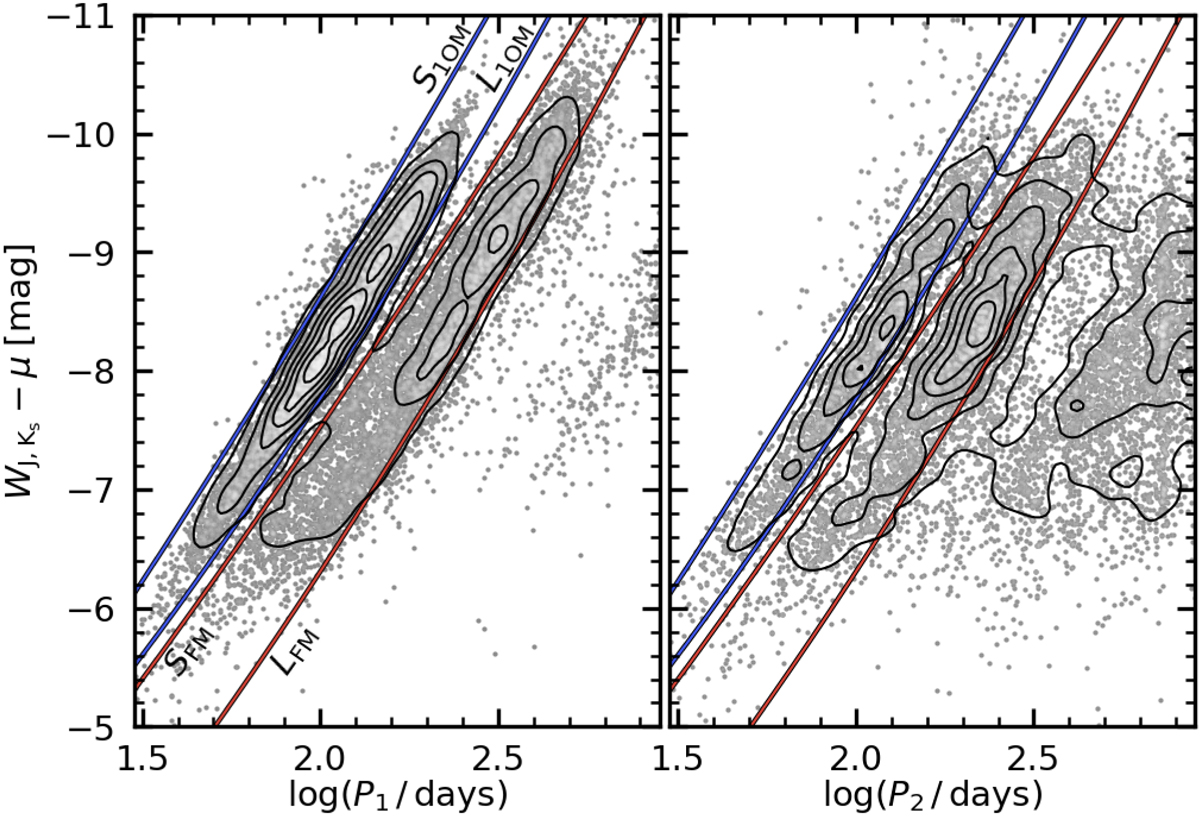
Period–luminosity diagram showing the boundaries adopted to assign the 1OM or FM to the periods of SRVs. Density contour lines are shown to visualise the slight offset of the secondary period sequences (right panel) towards longer periods compared to primary period sequences (left panel).
Current usage metrics show cumulative count of Article Views (full-text article views including HTML views, PDF and ePub downloads, according to the available data) and Abstracts Views on Vision4Press platform.
Data correspond to usage on the plateform after 2015. The current usage metrics is available 48-96 hours after online publication and is updated daily on week days.
Initial download of the metrics may take a while.