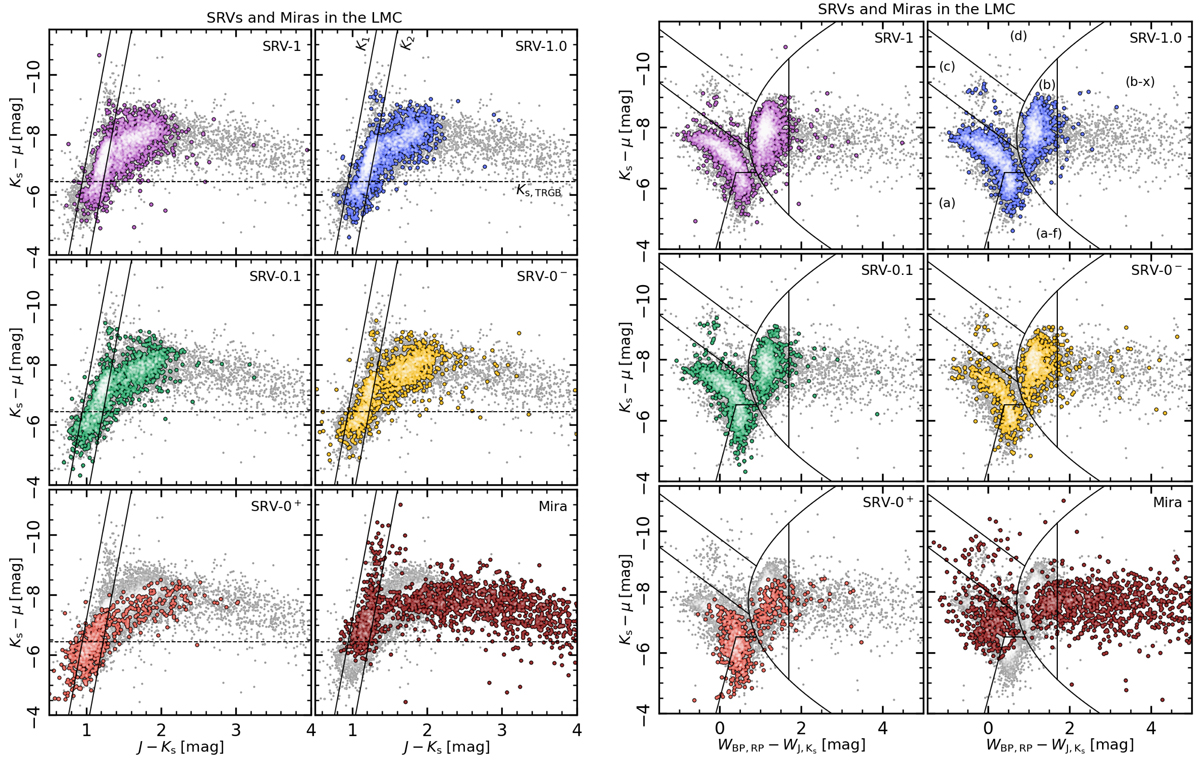
Fig. 11.
Download original image
2MASS colour–magnitude diagrams (set of panels on the left) and Gaia-2MASS diagram (set of panels on the right) of SRVs and Miras in the sample adopted here, limited to the LMC. Each panel in a given set corresponds to a different group of LPVs, according to the classification described in Sect. 3.2. The SRV-0 group is split into SRV-0− and SRV-0+ (see Sect. 4.1). The lines drawn to facilitate the comparison between 2MASS CMDs represent the RGB tip (dashed) and lines K1, K2 from Cioni et al. (2006), while lines in the Gaia-2MASS diagrams are from Lebzelter et al. (2019). We note that in both diagrams the horizontal range is truncated in order to focus on the region populated by SRVs, while Miras (and a few SRVs) extend as far as J − Ks ≃ 5 mag and WBP, RP − WJ, Ks ≃ 9 mag. Gaia EDR3 photometry is used to compute WBP, RP.
Current usage metrics show cumulative count of Article Views (full-text article views including HTML views, PDF and ePub downloads, according to the available data) and Abstracts Views on Vision4Press platform.
Data correspond to usage on the plateform after 2015. The current usage metrics is available 48-96 hours after online publication and is updated daily on week days.
Initial download of the metrics may take a while.