Fig. 1.
Download original image
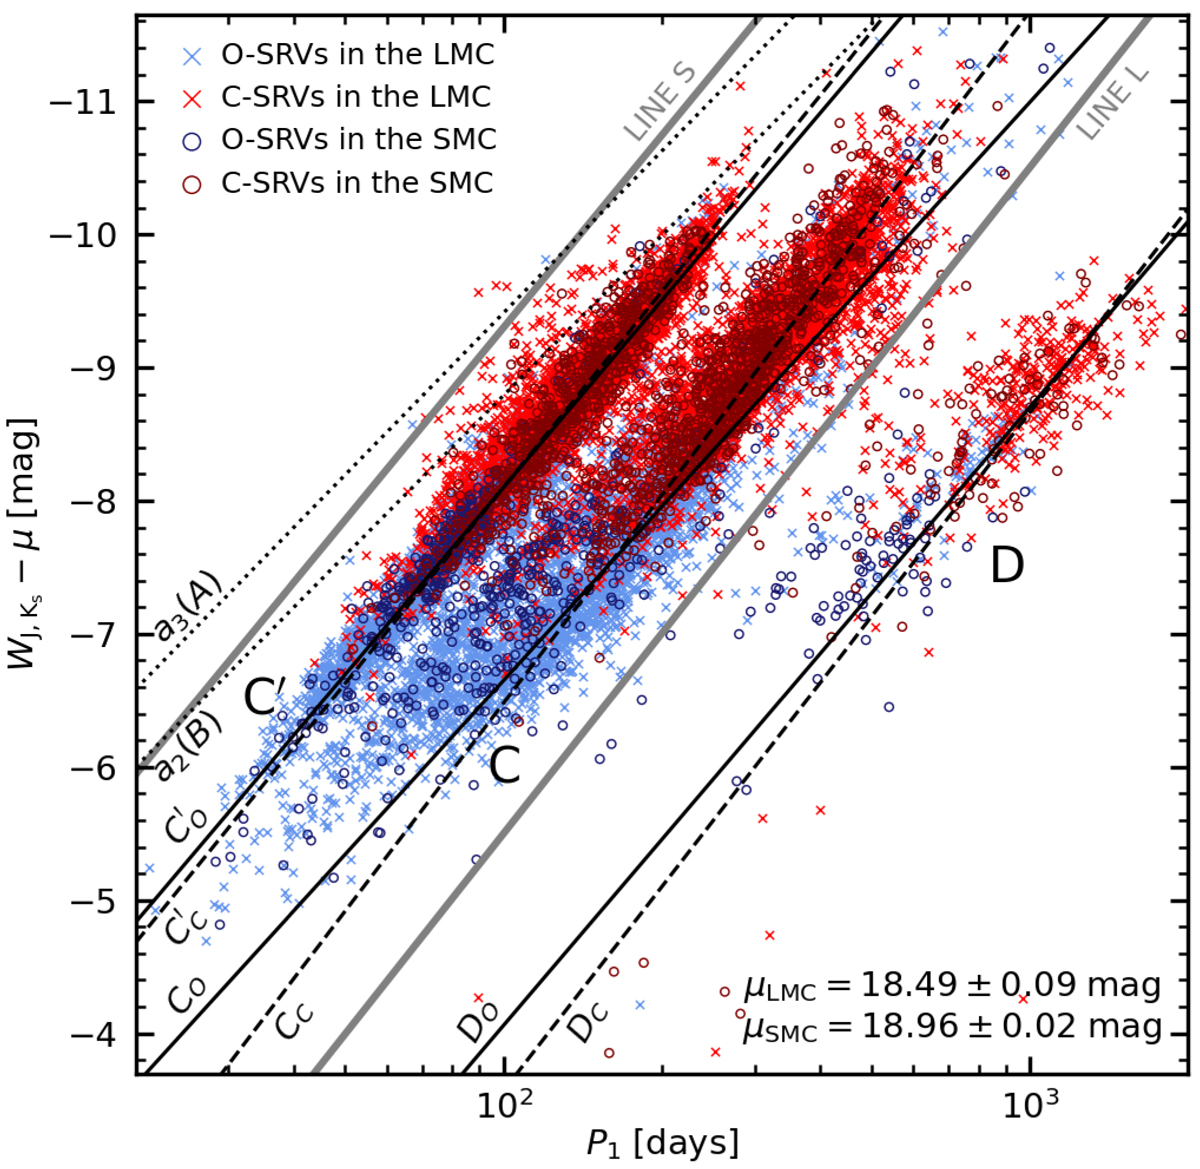
Primary variability period versus absolute WJ, Ks for OGLE-III SRVs in the LMC (crosses) and SMC (circles), with tones of blue and red indicating O- and C-rich sources, respectively. Black lines are best fits to the PL sequences of LPVs in the LMC (from Soszyński et al. 2007, adjusted for a distance modulus μ = 18.49). More precisely, the best fits to sequences C′, C, and D are shown as solid or dashed lines depending on whether they were obtained on the sample of O- or C-rich stars. The dotted lines correspond to sequences A and B, which are referred to as a3 and a2 by Soszyński et al. (2007). Thick grey lines are used to exclude periods from the sample (see text and Table 1).
Current usage metrics show cumulative count of Article Views (full-text article views including HTML views, PDF and ePub downloads, according to the available data) and Abstracts Views on Vision4Press platform.
Data correspond to usage on the plateform after 2015. The current usage metrics is available 48-96 hours after online publication and is updated daily on week days.
Initial download of the metrics may take a while.