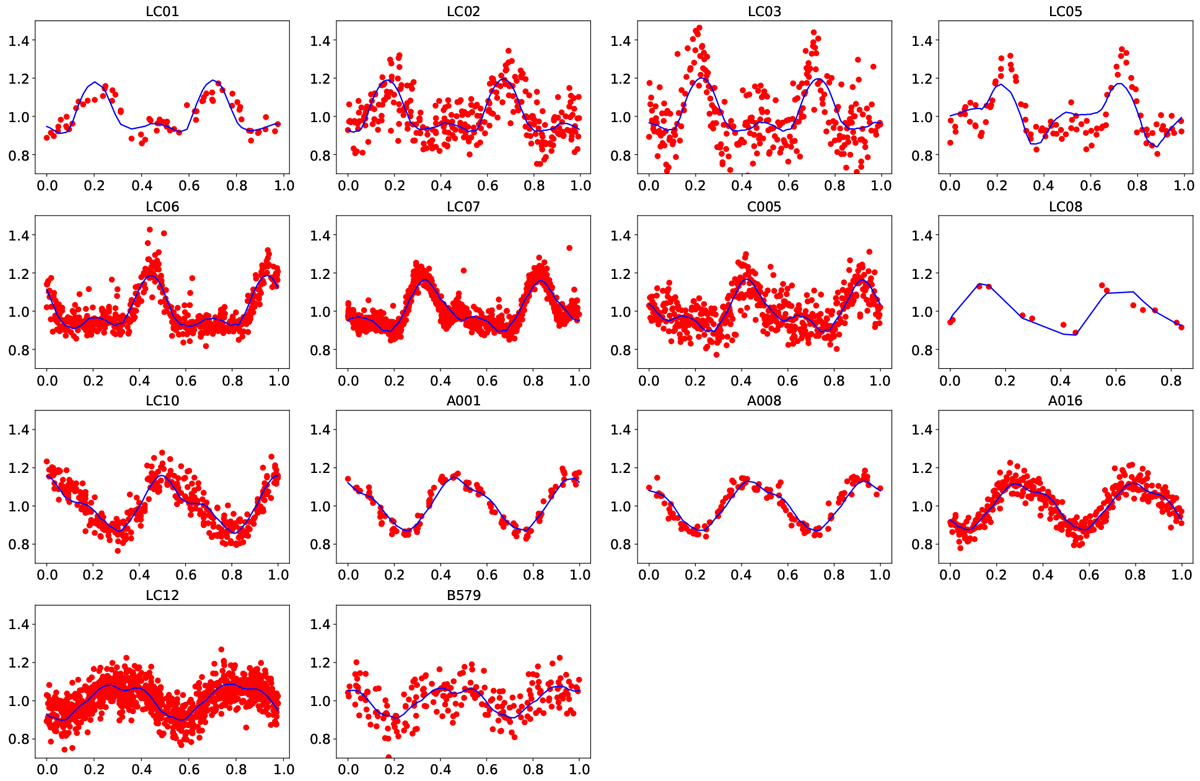
Fig. 5
Download original image
Superposition of the model A lightcurves (continuous line) on the data points obtained from observations. All plots were drawn in the same coordinates: the x-axis is the rotation phase (in the range from 0 to 1), and the y-axis refers to the flux scaled to unity for the average brightness. We note that our convex model has problems with recreating sharp brightness maxima in LC03, LC05, and LC06 lightcurves. They are most likely caused by concavities on the asteroid surface.
Current usage metrics show cumulative count of Article Views (full-text article views including HTML views, PDF and ePub downloads, according to the available data) and Abstracts Views on Vision4Press platform.
Data correspond to usage on the plateform after 2015. The current usage metrics is available 48-96 hours after online publication and is updated daily on week days.
Initial download of the metrics may take a while.