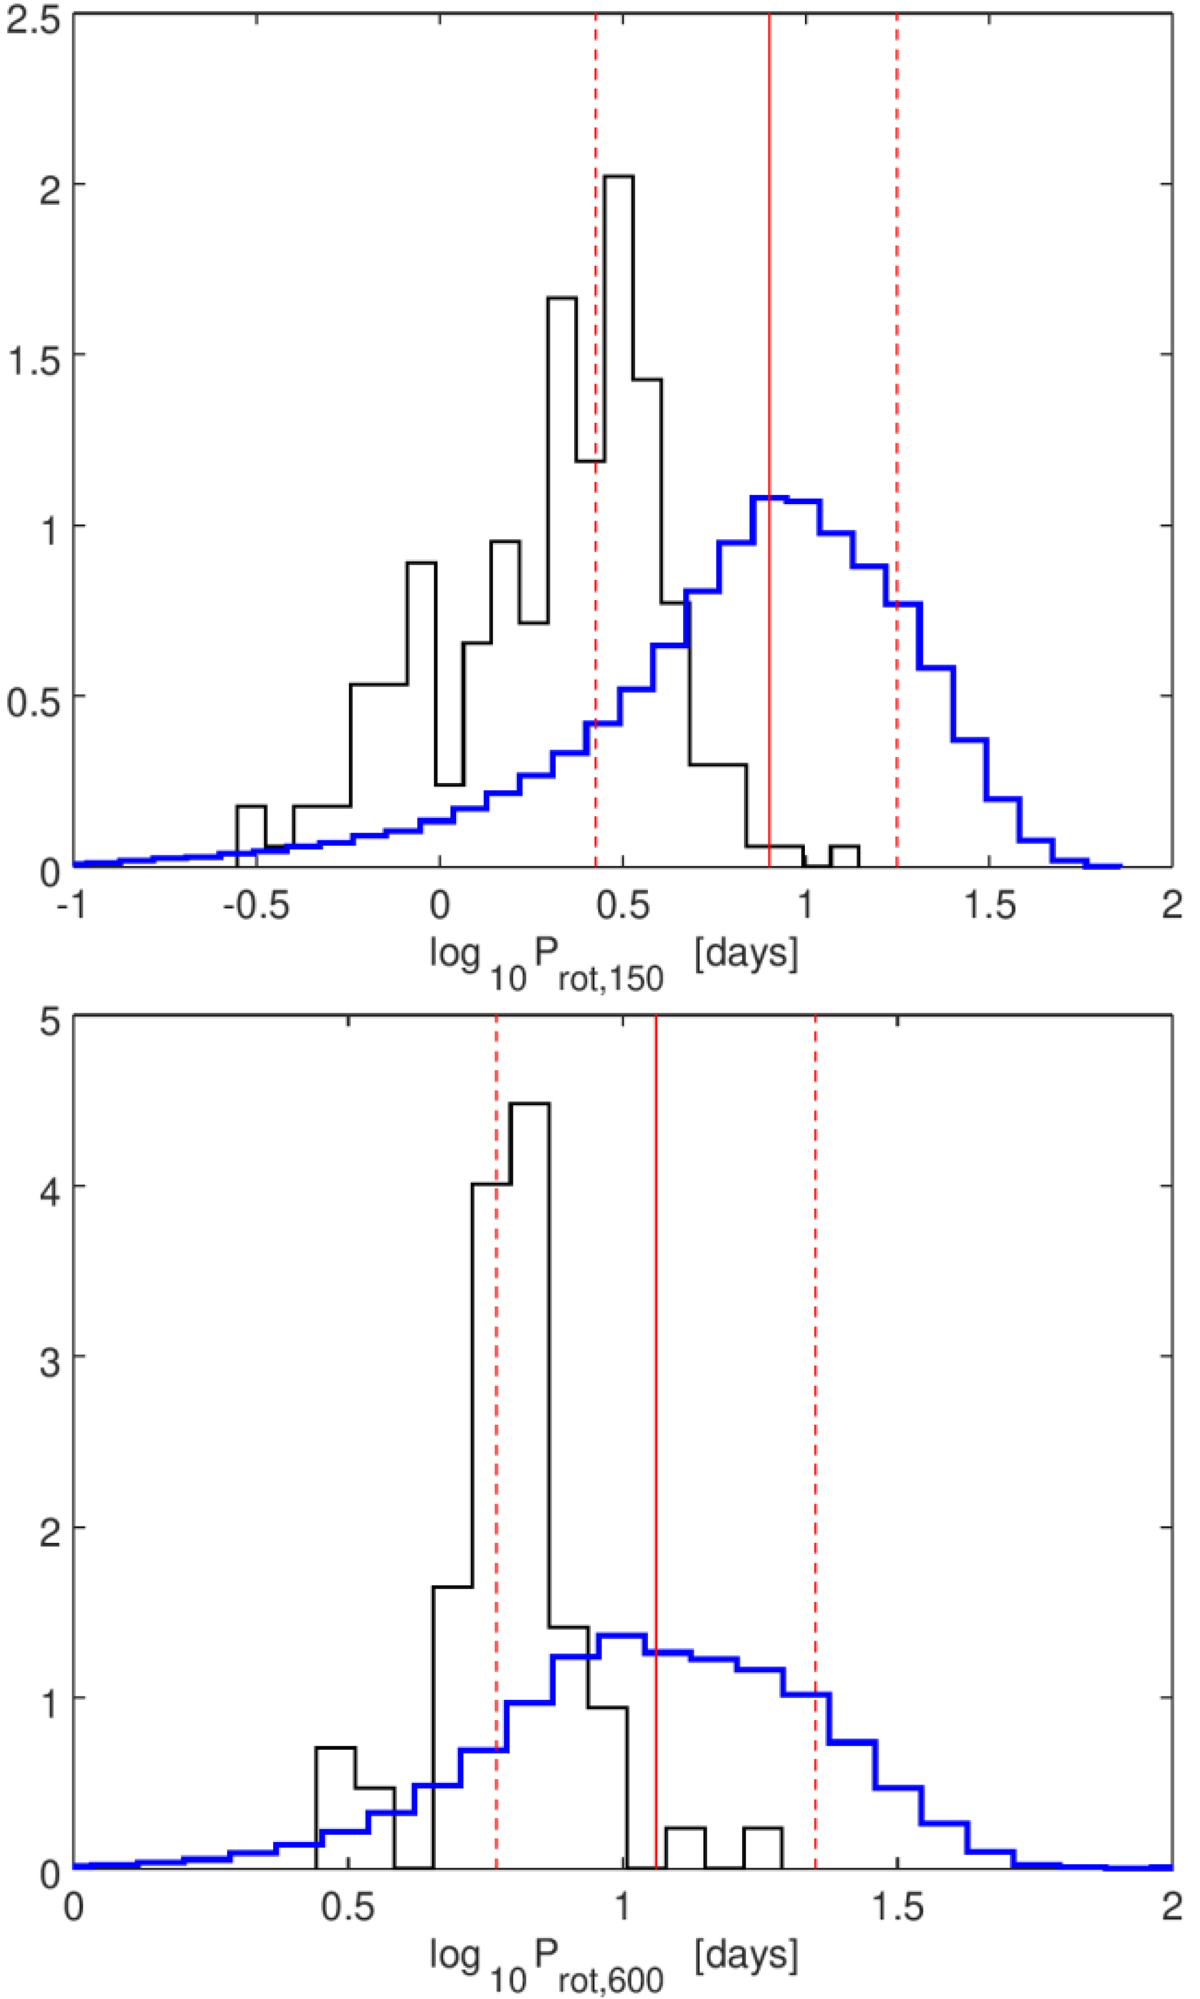
Fig. 6.
Download original image
Top: comparison between the Prot,150 PDF obtained by combining those distributions extracted from the analysed sample (blue line) and the Prot,150 distribution extracted from Johnstone et al. (2015a), considering stars member of ∼150 Myr old OCs and having the same mass distribution as the planet-hosting stars analysed in this work. The vertical solid red line marks the median value of the distribution shown by the blue line, while the two vertical dashed red lines indicate the 15.87th and 84.14th percentiles. Bottom: same as the top panel, but for the Prot,600 PDF.
Current usage metrics show cumulative count of Article Views (full-text article views including HTML views, PDF and ePub downloads, according to the available data) and Abstracts Views on Vision4Press platform.
Data correspond to usage on the plateform after 2015. The current usage metrics is available 48-96 hours after online publication and is updated daily on week days.
Initial download of the metrics may take a while.