Fig. 5.
Download original image
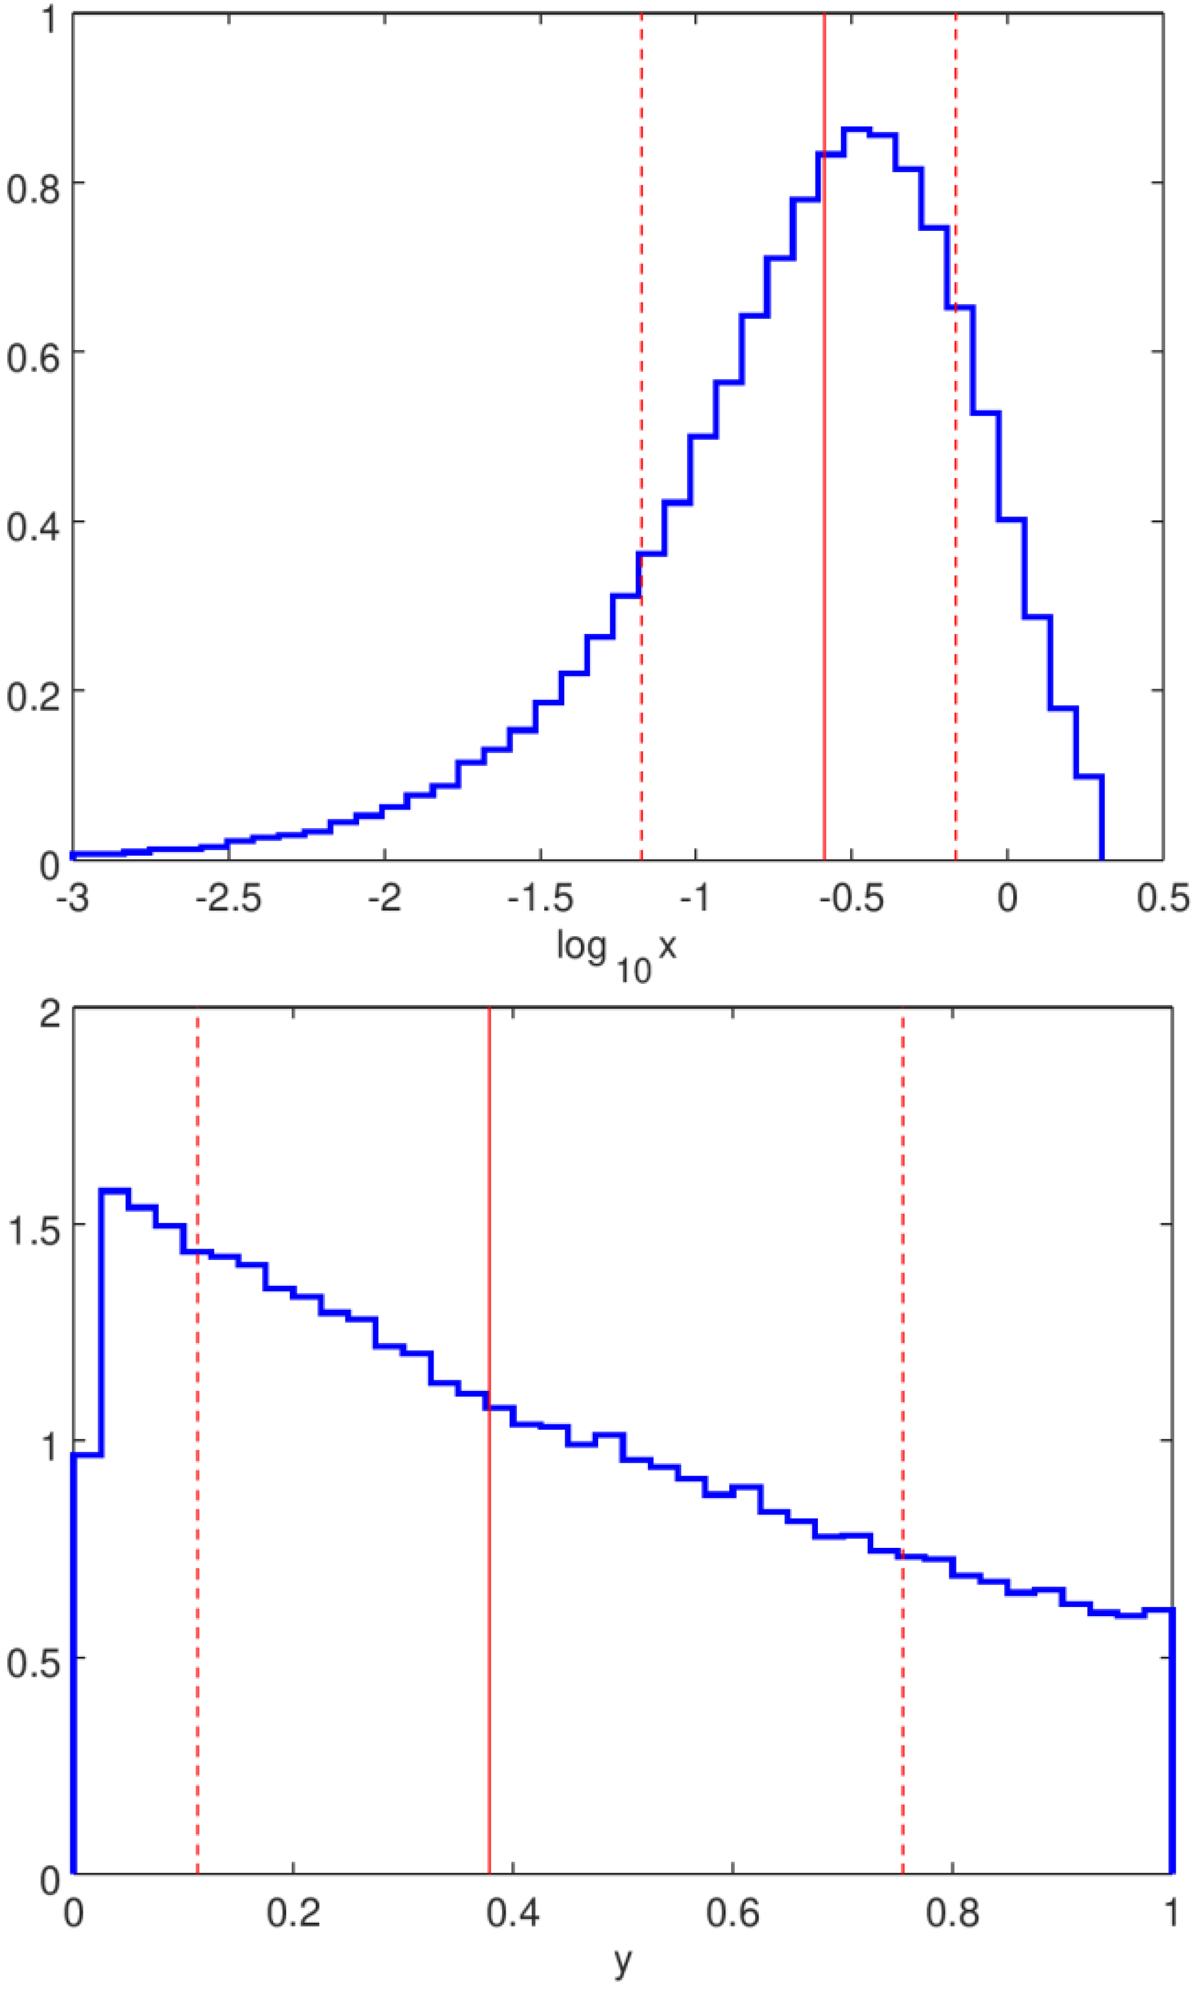
Top: PDF of the x exponent of our adopted gyrochronological relations expressed in Eqs. (1) and (2) built upon all the stellar targets analysed in this work. The vertical solid red line marks the median of the distribution, while the two vertical dashed red lines marks the σ levels corresponding to the 15.87th and 84.14th percentiles. Bottom: same as the top panel, but for the y exponent of Eq. (2). We note that the top panel is in log scale.
Current usage metrics show cumulative count of Article Views (full-text article views including HTML views, PDF and ePub downloads, according to the available data) and Abstracts Views on Vision4Press platform.
Data correspond to usage on the plateform after 2015. The current usage metrics is available 48-96 hours after online publication and is updated daily on week days.
Initial download of the metrics may take a while.