Fig. 3
Download original image
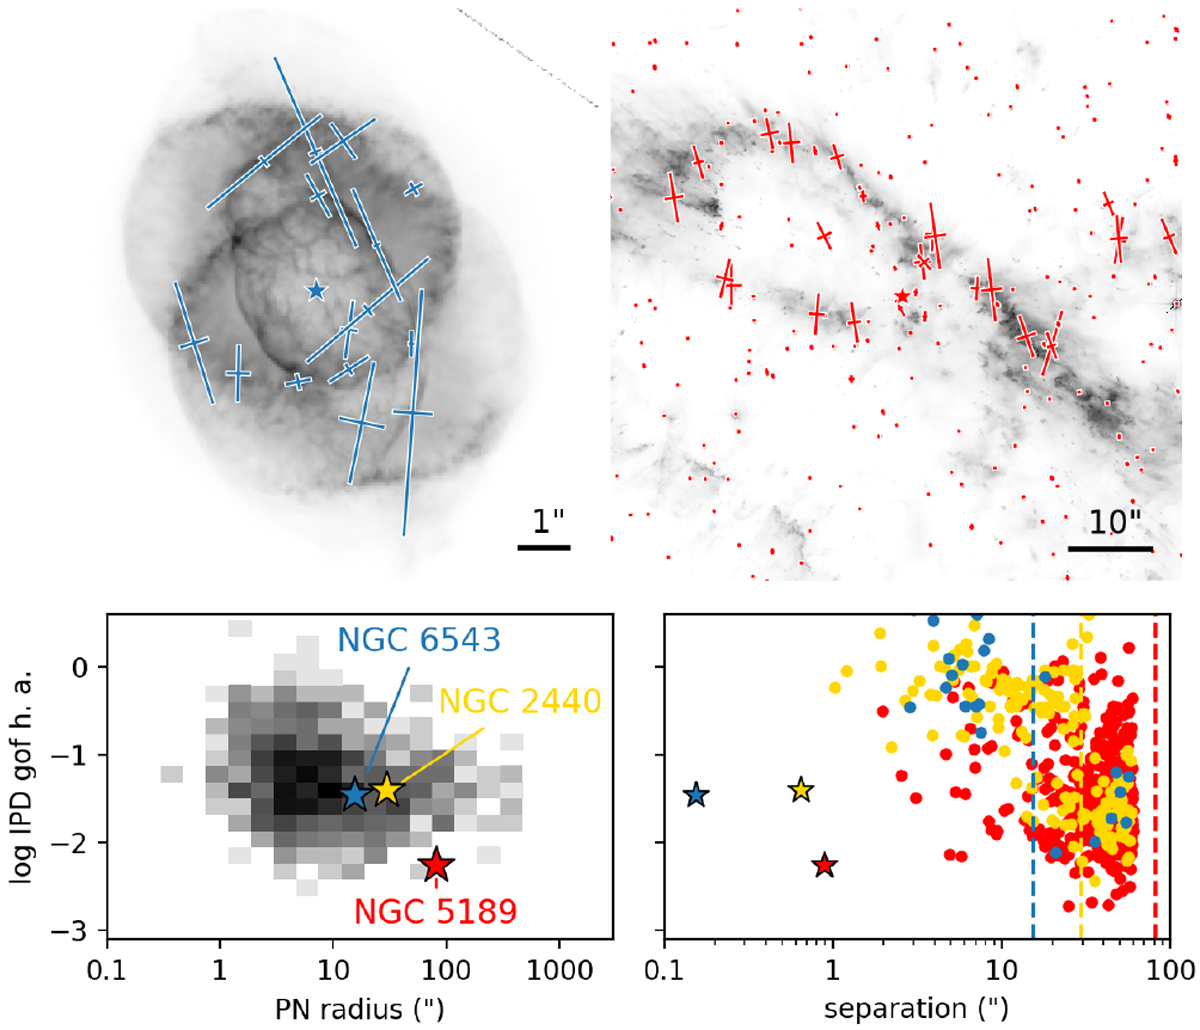
Nebula detections for bright PNe. The upper images are HST narrowband images of NGC 6543 (left) and the central region of NGC 5189 (right) overlayed with Gaia EDR3 sources (coloured points and crosses). Error bars have been rotated to reflect the direction of the principle component of the error covariance matrices, and scaled by a factor of 100 for visibility. The lower plots show the distribution of IPD goodness-of-fit harmonic amplitudes.The left plot shows the distribution for the best matches versus PN angular radius on a linear colour map for all best matches in our catalogue, with locations of the CSPNe of the PNe above (and NGC 2440 from Fig. 2) highlighted. The right plot shows all sources in the vicinity of these PNe, plotted against angular separation on a log scale. Vertical lines indicate the PN radii; the lack of points past 60′′ is a result of our selection cutoff. (Images credit: Hubble Legacy Archive/ESA/NASA.)
Current usage metrics show cumulative count of Article Views (full-text article views including HTML views, PDF and ePub downloads, according to the available data) and Abstracts Views on Vision4Press platform.
Data correspond to usage on the plateform after 2015. The current usage metrics is available 48-96 hours after online publication and is updated daily on week days.
Initial download of the metrics may take a while.