Fig. 1
Download original image
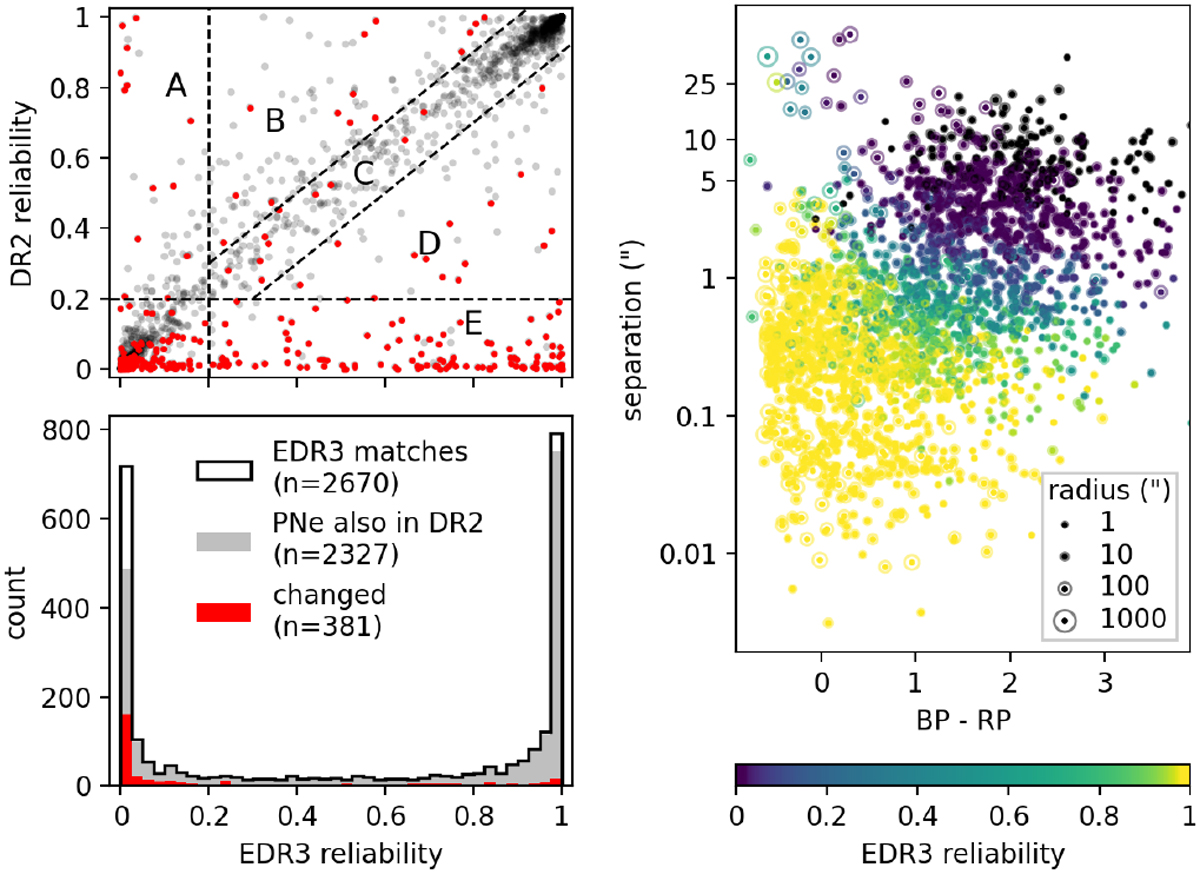
Matching results for ‘true’ PNe. Top left panel: reliability of the CW20 Gaia DR2 matches versus the EDR3 matches from this work for PNe present in both. Red points are PNe where the location of the best candidate match has changed by more than 0′′.1. All of thesepoints are contained in the histogram in the lower left panel, which also includes PNe that were not in CW20. Upper right panel: separation versus colour distribution of highest-ranked candidates, colour-coded by reliability with the non-linear scale shown in the bottom right corner. Rings around markers indicate PN angular sizes.
Current usage metrics show cumulative count of Article Views (full-text article views including HTML views, PDF and ePub downloads, according to the available data) and Abstracts Views on Vision4Press platform.
Data correspond to usage on the plateform after 2015. The current usage metrics is available 48-96 hours after online publication and is updated daily on week days.
Initial download of the metrics may take a while.