Fig. 8
Download original image
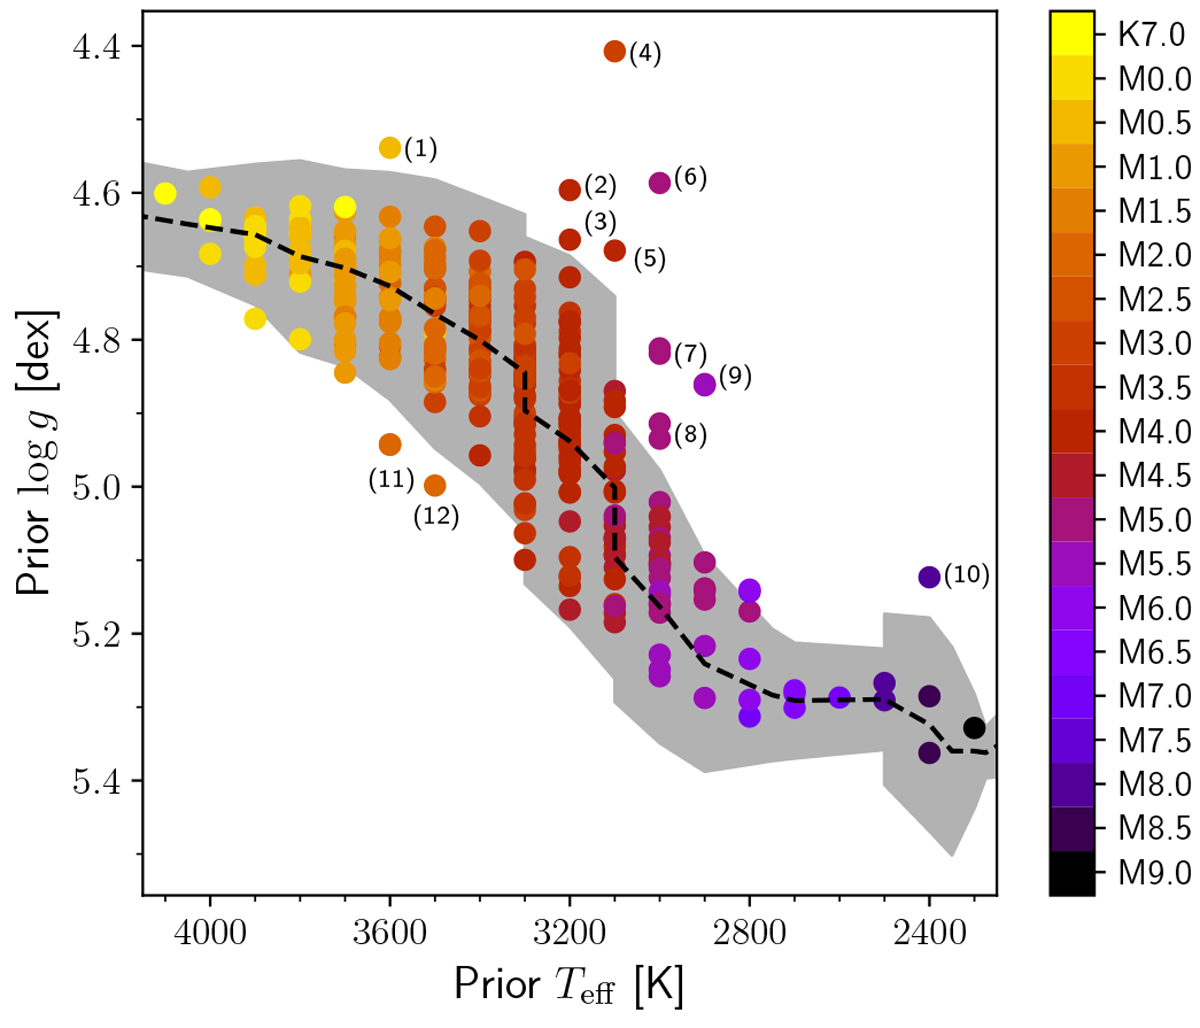
Central prior Teff and log g values for the sample following Cifuentes et al. (2020). The spectral types are colour-coded. The dashed black line is the average Teff and log g for K7 V to M9.0 V objects, with the corresponding uncertainties shaded in grey. The 15 outliers discussed in Sect. 3.4 are labelled and listed in Table 4. Two and three stars are superimposed under labels (7) and (11), respectively.
Current usage metrics show cumulative count of Article Views (full-text article views including HTML views, PDF and ePub downloads, according to the available data) and Abstracts Views on Vision4Press platform.
Data correspond to usage on the plateform after 2015. The current usage metrics is available 48-96 hours after online publication and is updated daily on week days.
Initial download of the metrics may take a while.