Fig. 15
Download original image
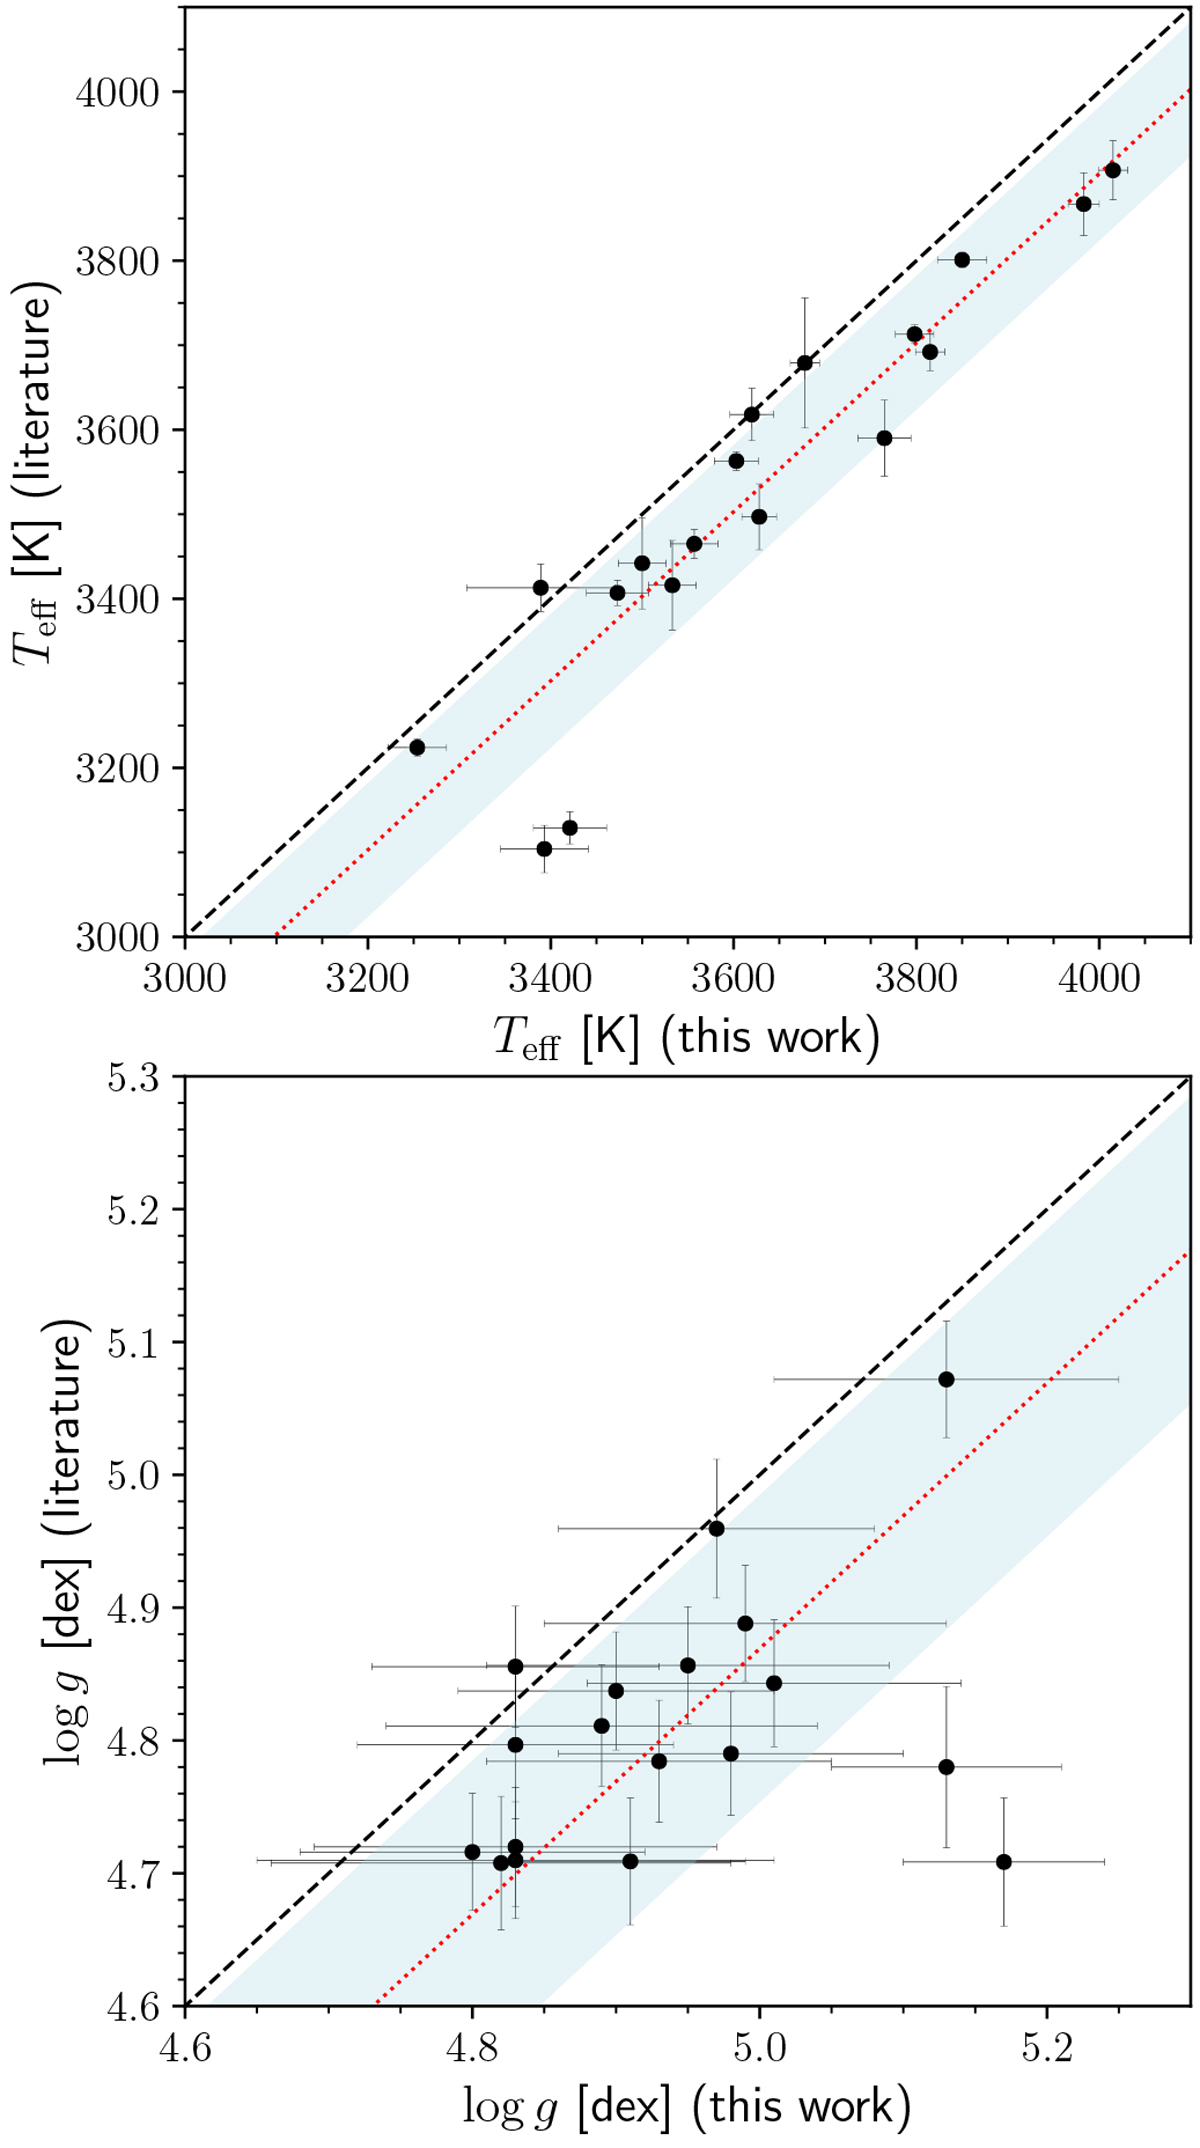
Comparison in Teff (upper panel) and logg (bottom panel) for M dwarfs with interferometric angular measurements (see Table 6). The dashed black lines indicate the 1:1 relationship, whereas the dotted red lines show the 1:1 relationship, shifted following the average differences in each parameter. The blue shaded region denotes the 1σ level.
Current usage metrics show cumulative count of Article Views (full-text article views including HTML views, PDF and ePub downloads, according to the available data) and Abstracts Views on Vision4Press platform.
Data correspond to usage on the plateform after 2015. The current usage metrics is available 48-96 hours after online publication and is updated daily on week days.
Initial download of the metrics may take a while.