Fig. 9.
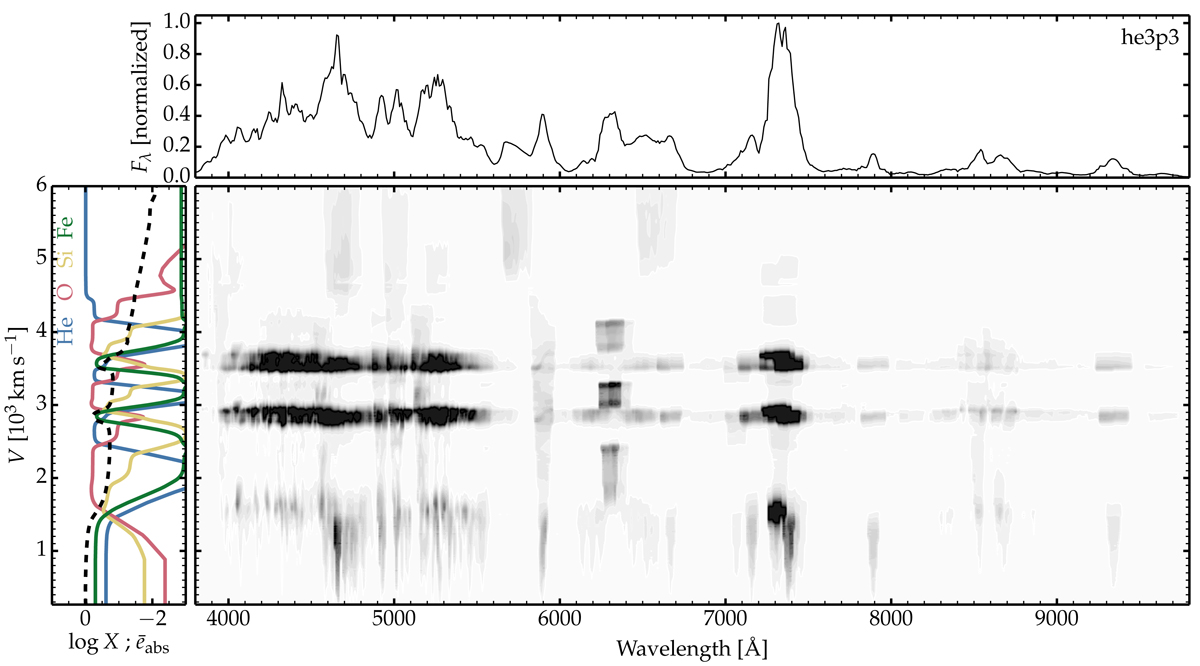
Download original image
Illustration of the spatial regions (here shown in velocity space) contributing to the emergent flux in the he3p3 model. The grayscale image shows the observer’s frame flux contribution ∂Fλ, V/∂V (the map maximum is saturated at 20% of the true maximum to bias against the strong emission lines and better reveal the origin of the weaker emission) versus wavelength and ejecta velocity. The panel at left connects these emission contributions to ejecta shells and the decay-power deposition profile (dashed line) on the same velocity scale. The upper panel shows the corresponding (scaled) flux Fλ integrated over all ejecta velocities.
Current usage metrics show cumulative count of Article Views (full-text article views including HTML views, PDF and ePub downloads, according to the available data) and Abstracts Views on Vision4Press platform.
Data correspond to usage on the plateform after 2015. The current usage metrics is available 48-96 hours after online publication and is updated daily on week days.
Initial download of the metrics may take a while.