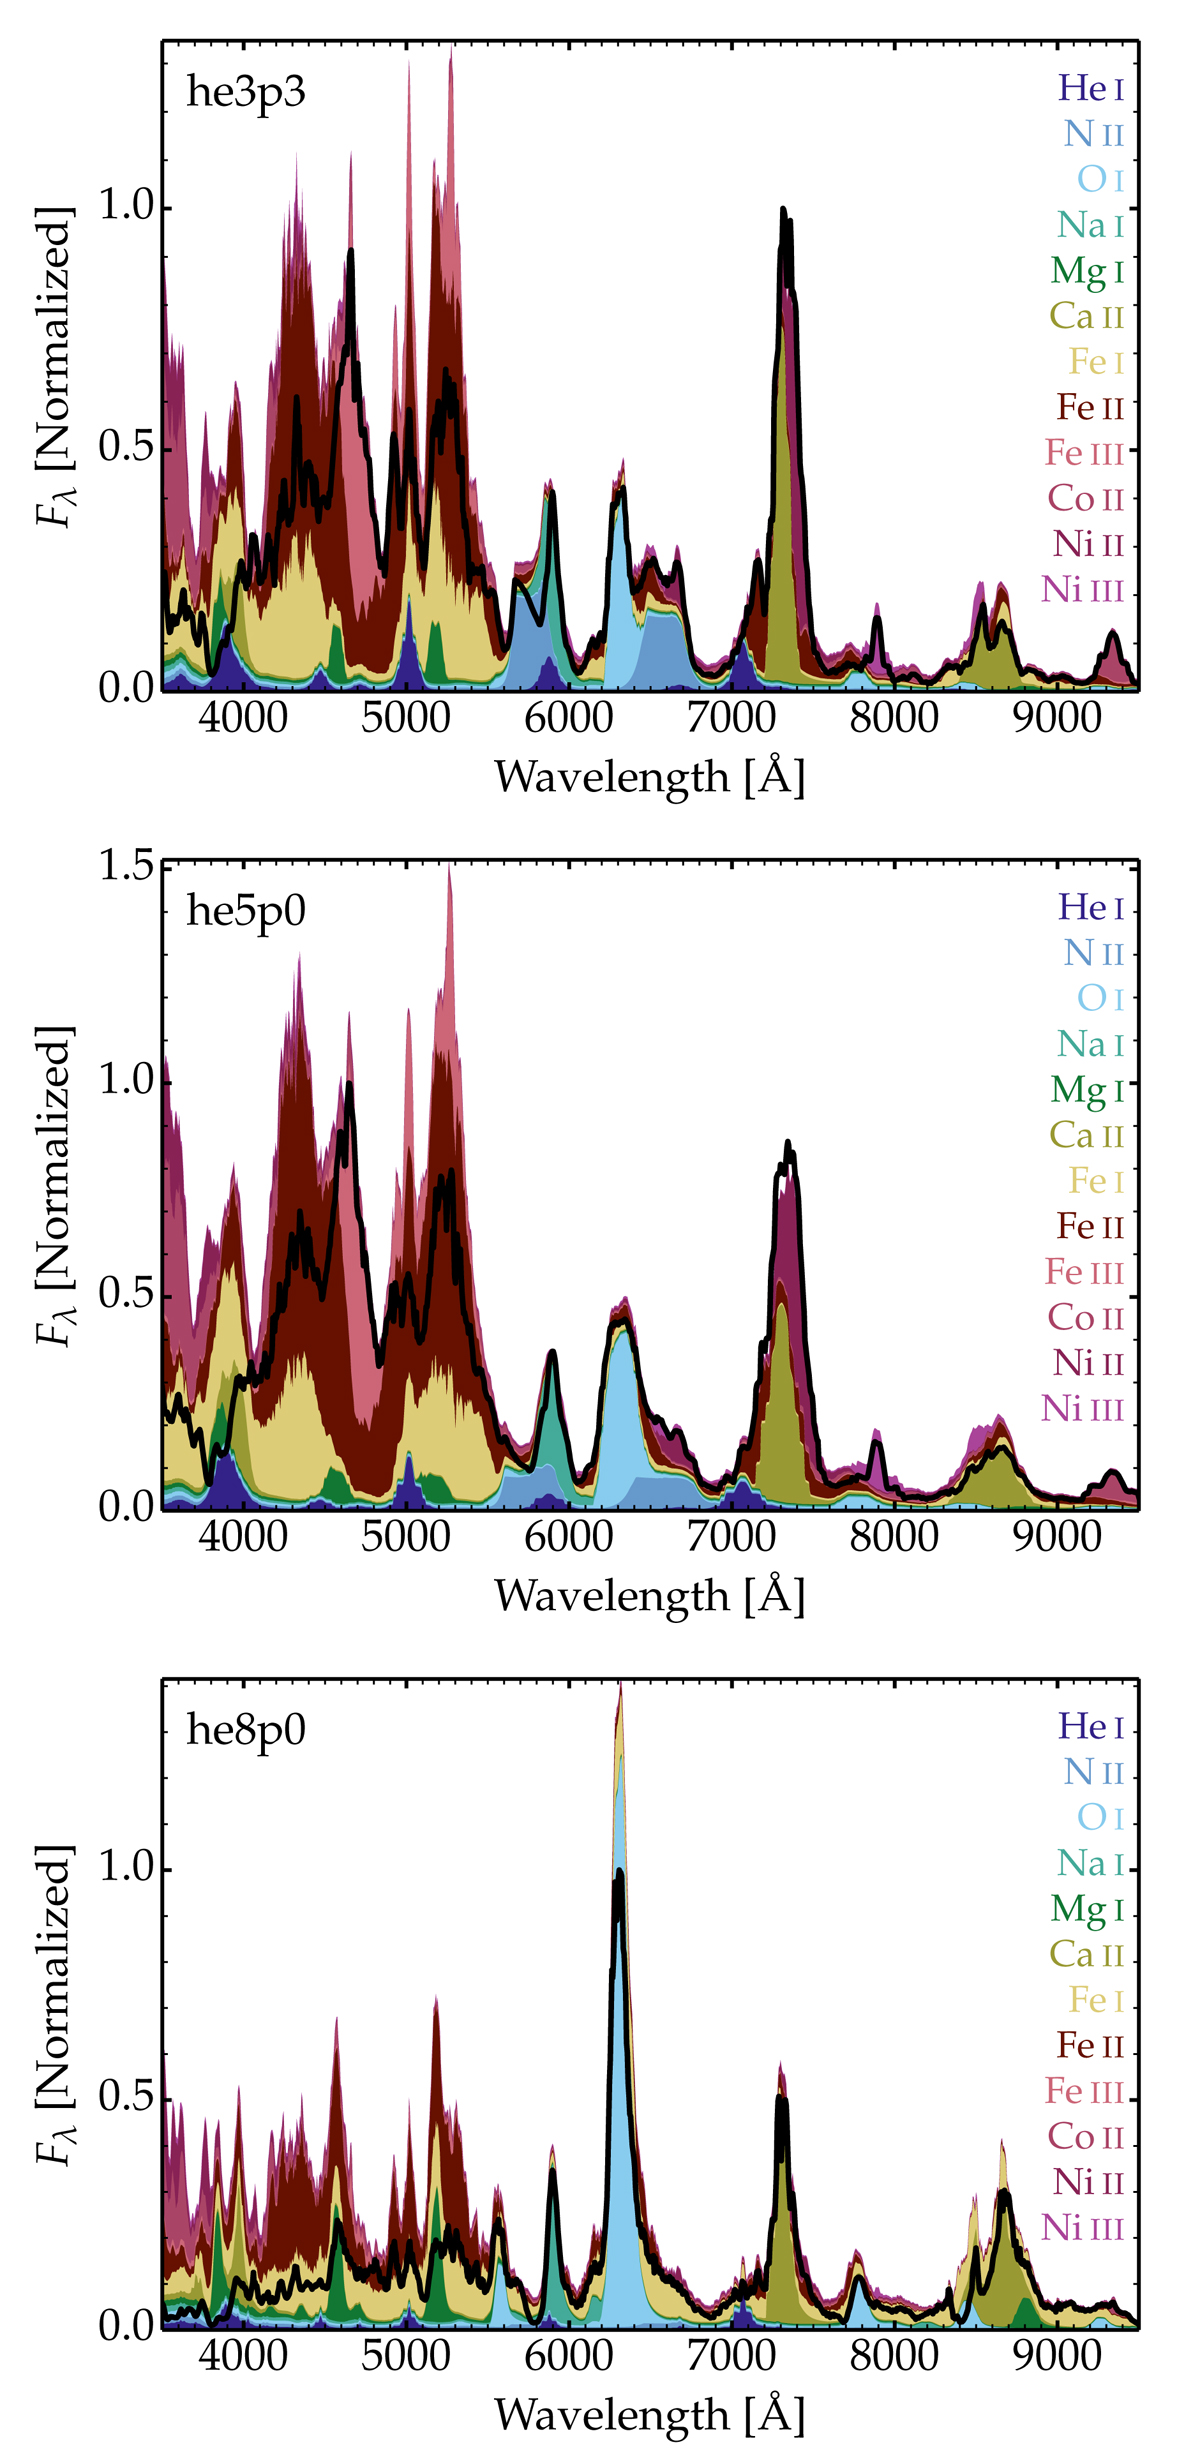
Fig. 6.
Download original image
Illustration of the flux contribution of individual ions to the total flux (thick black line) for models he3p3, he5p0, and he8p0. The individual contributions account for all bound-bound transitions of a specific ion but ignores the influence of line transitions in other ions. Thus, it accounts only for optical-depth effects intrinsic to that ion. For the plotting, we avoid overlap of these flux contributions by showing the cumulative flux contributions, starting with those due to He I, then to N II, etc. This stacking implies that at a given wavelength, the contribution is given by the height separating consecutive colors. This also helps to distinguish similar colors. In numerous spectral regions, the total flux lies below the cumulative flux from the depicted ions, which indicates that photons emitted by one species are being absorbed by another species.
Current usage metrics show cumulative count of Article Views (full-text article views including HTML views, PDF and ePub downloads, according to the available data) and Abstracts Views on Vision4Press platform.
Data correspond to usage on the plateform after 2015. The current usage metrics is available 48-96 hours after online publication and is updated daily on week days.
Initial download of the metrics may take a while.