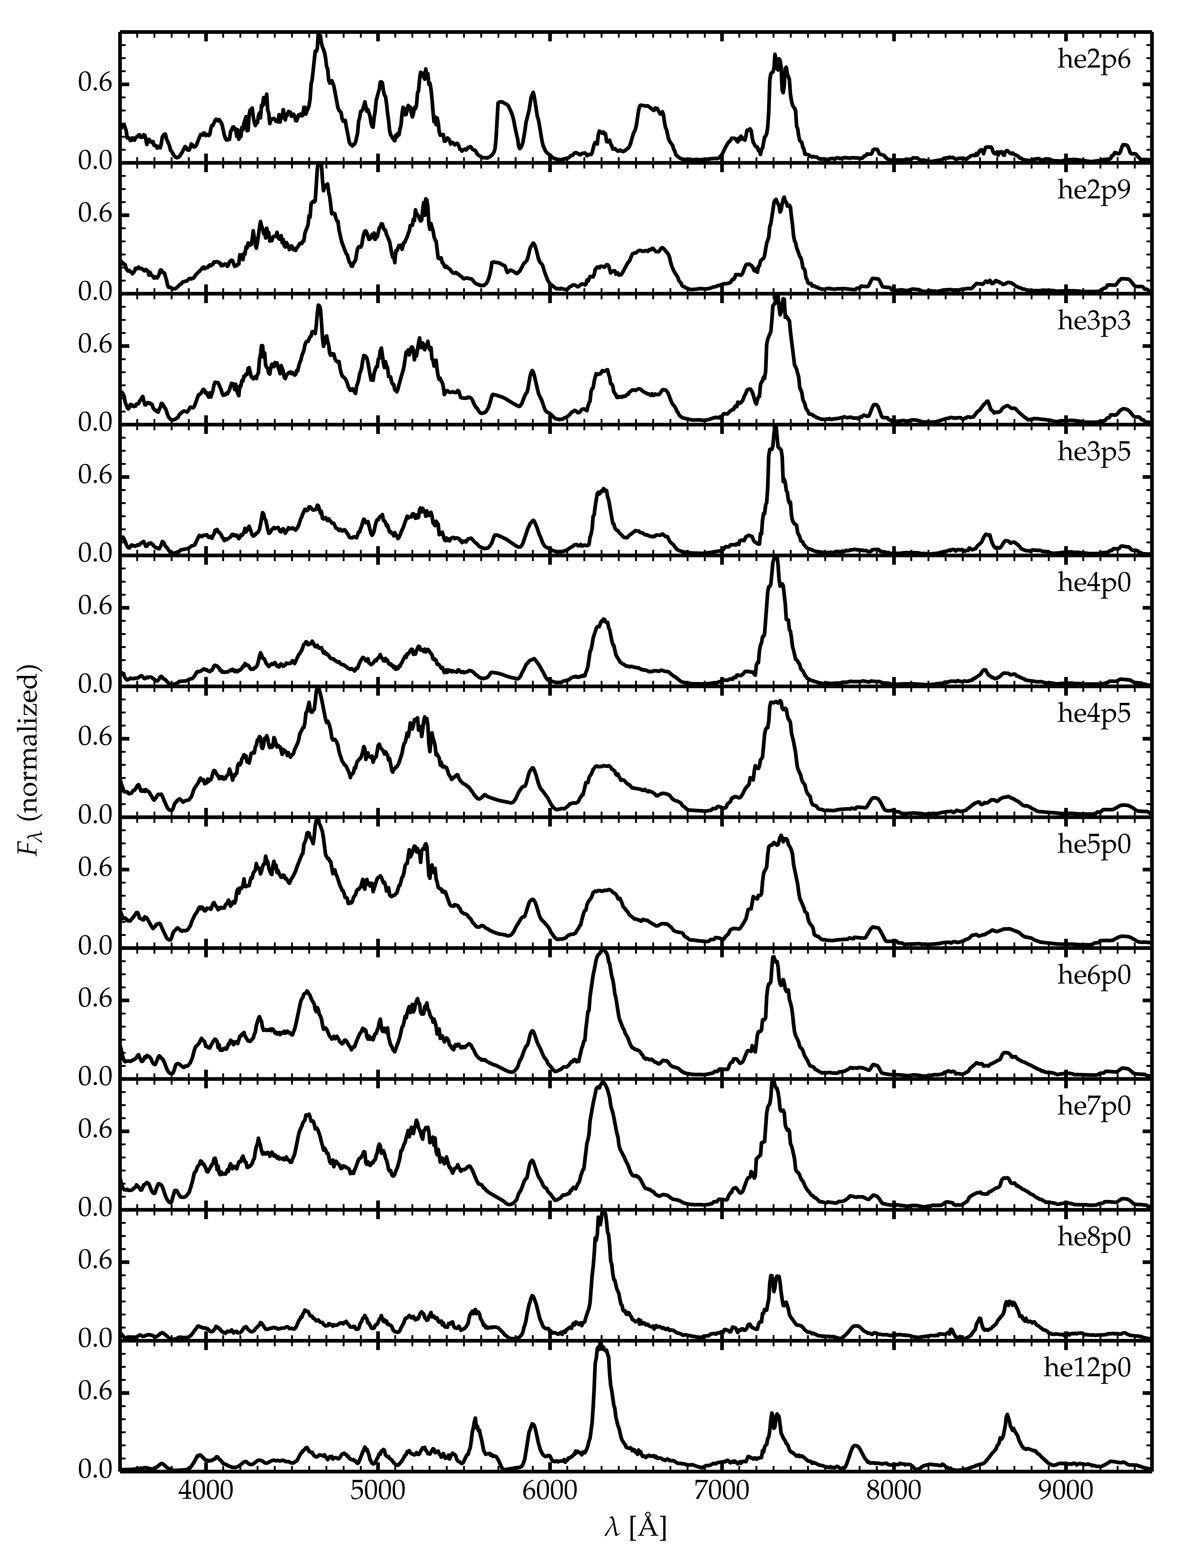
Fig. 4.
Download original image
Montage of spectra for the set of explosion models at 200 d after explosion (each spectrum is normalized so that the maximum flux is unity). There are strong variations in the iron forest between 4000 and 5500 Å, and in the strength of [N II] λλ 6548, 6583, [N II] λ 5755, [O I] λλ 6300, 6364, [Ca II] λλ 7291, 7323 and Ca IIλλ 8498 − 8662. The models are based on the He-star progenitors evolved with the nominal mass loss rate (Woosley 2019; Ertl et al. 2020).
Current usage metrics show cumulative count of Article Views (full-text article views including HTML views, PDF and ePub downloads, according to the available data) and Abstracts Views on Vision4Press platform.
Data correspond to usage on the plateform after 2015. The current usage metrics is available 48-96 hours after online publication and is updated daily on week days.
Initial download of the metrics may take a while.