Fig. 22.
Download original image
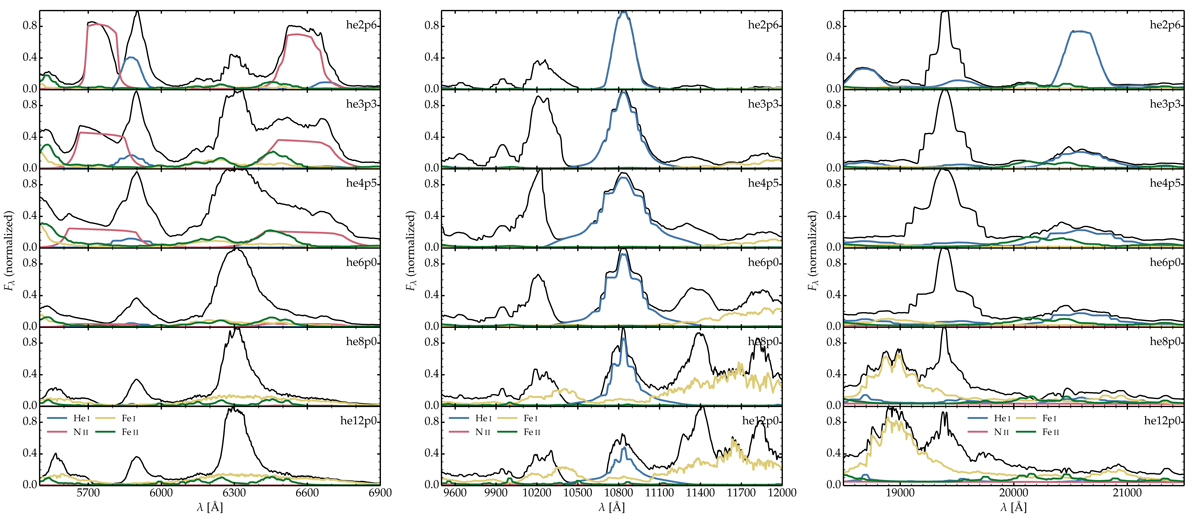
Montage of spectra for models he2p6, he3p3, he4p5, he6p0, he8p0, and he12p0 at 200 d showing the wavelength region around 6300 Å (left), around 10 800 Å (middle), and around 20 000 Å (right). In all plots, we overplot the emission associated with bound-bound transitions from He I, N II, Fe I, and Fe II. The same species set and color coding is used even when some species or ions do not contribute flux to the selected spectral region.
Current usage metrics show cumulative count of Article Views (full-text article views including HTML views, PDF and ePub downloads, according to the available data) and Abstracts Views on Vision4Press platform.
Data correspond to usage on the plateform after 2015. The current usage metrics is available 48-96 hours after online publication and is updated daily on week days.
Initial download of the metrics may take a while.