Fig. 10.
Download original image
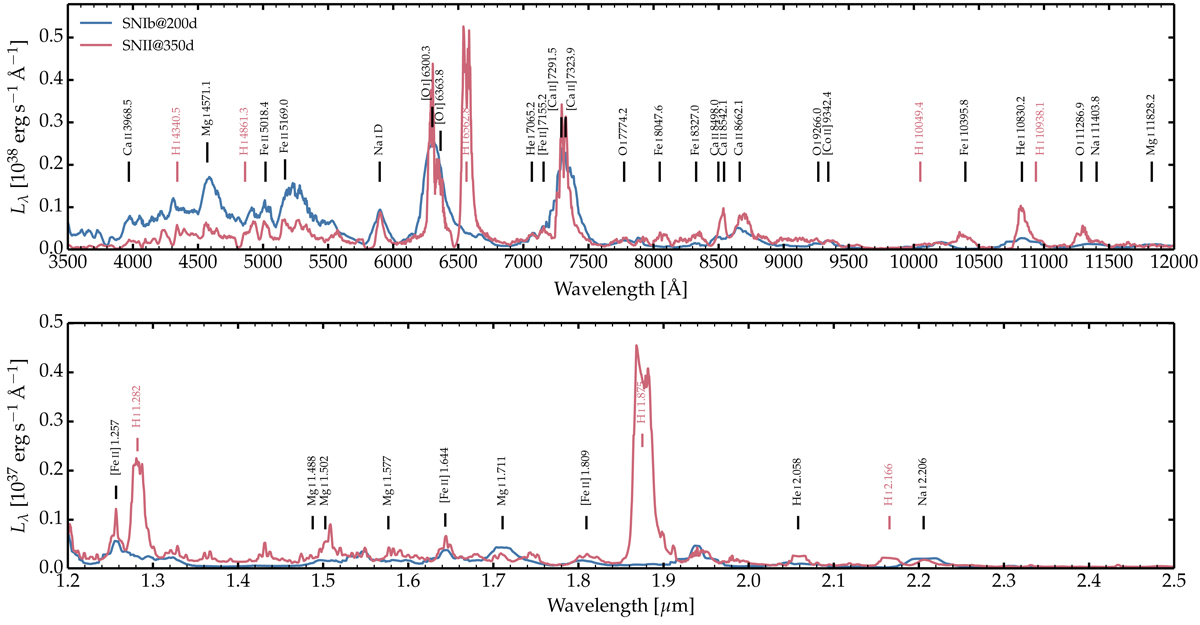
Comparison of optical and near-infrared spectra of the Type II SN model s15p2 at 350 d (Dessart et al. 2021) and the Type Ib model he6p0 at 200 d (present work). Some line identifications are indicated but should be interpreted with caution since apart from the strongest features (which are often line multiplets), most spectral features are blends of many transitions. The strongest Balmer and Paschen lines are present only in the SN II model and are labeled in red.
Current usage metrics show cumulative count of Article Views (full-text article views including HTML views, PDF and ePub downloads, according to the available data) and Abstracts Views on Vision4Press platform.
Data correspond to usage on the plateform after 2015. The current usage metrics is available 48-96 hours after online publication and is updated daily on week days.
Initial download of the metrics may take a while.