Free Access
Fig. 17.
Download original image
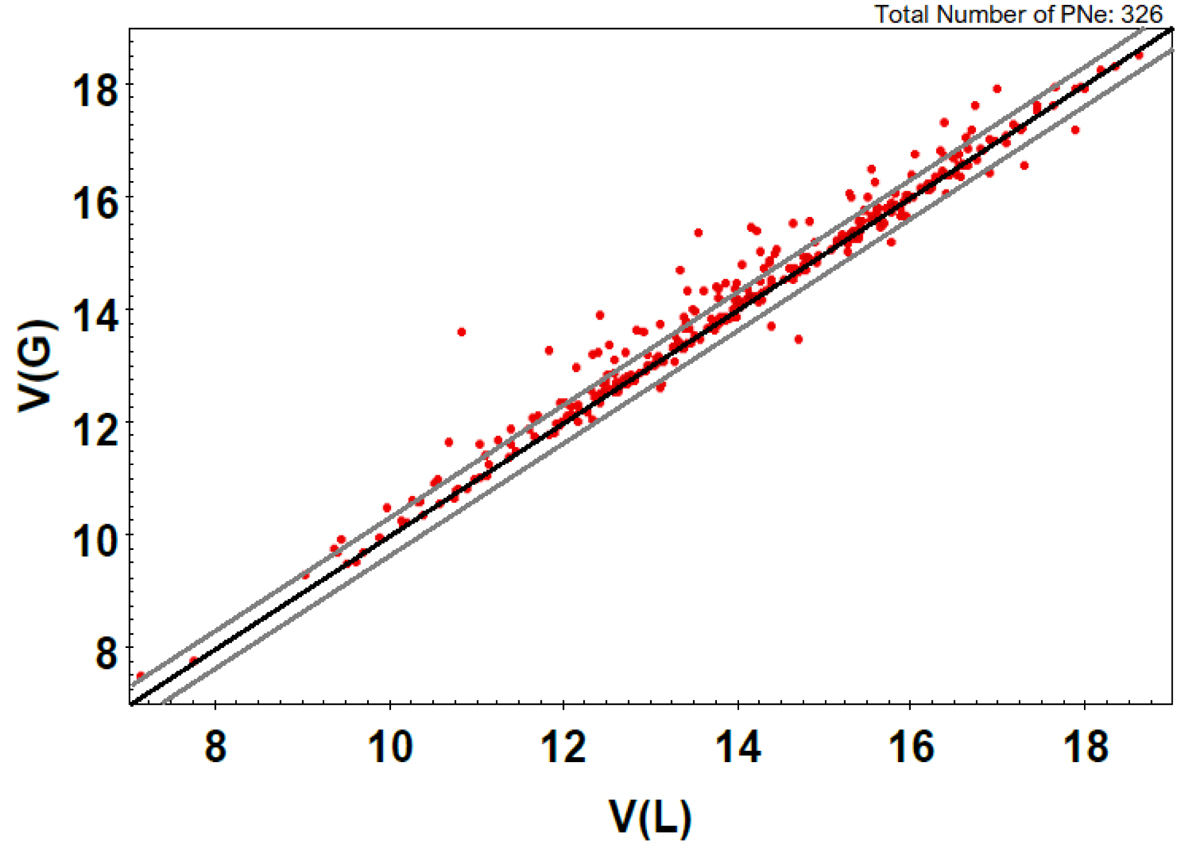
Comparison between V magnitudes from the literature (VL) and V magnitudes calculated from Gaia passbands (VG) for 326 objects of the GAPN-EDR3 sample. The black central line indicates the 1:1 relation, while grey lines indicate the threshold for the mild outliers.
Current usage metrics show cumulative count of Article Views (full-text article views including HTML views, PDF and ePub downloads, according to the available data) and Abstracts Views on Vision4Press platform.
Data correspond to usage on the plateform after 2015. The current usage metrics is available 48-96 hours after online publication and is updated daily on week days.
Initial download of the metrics may take a while.