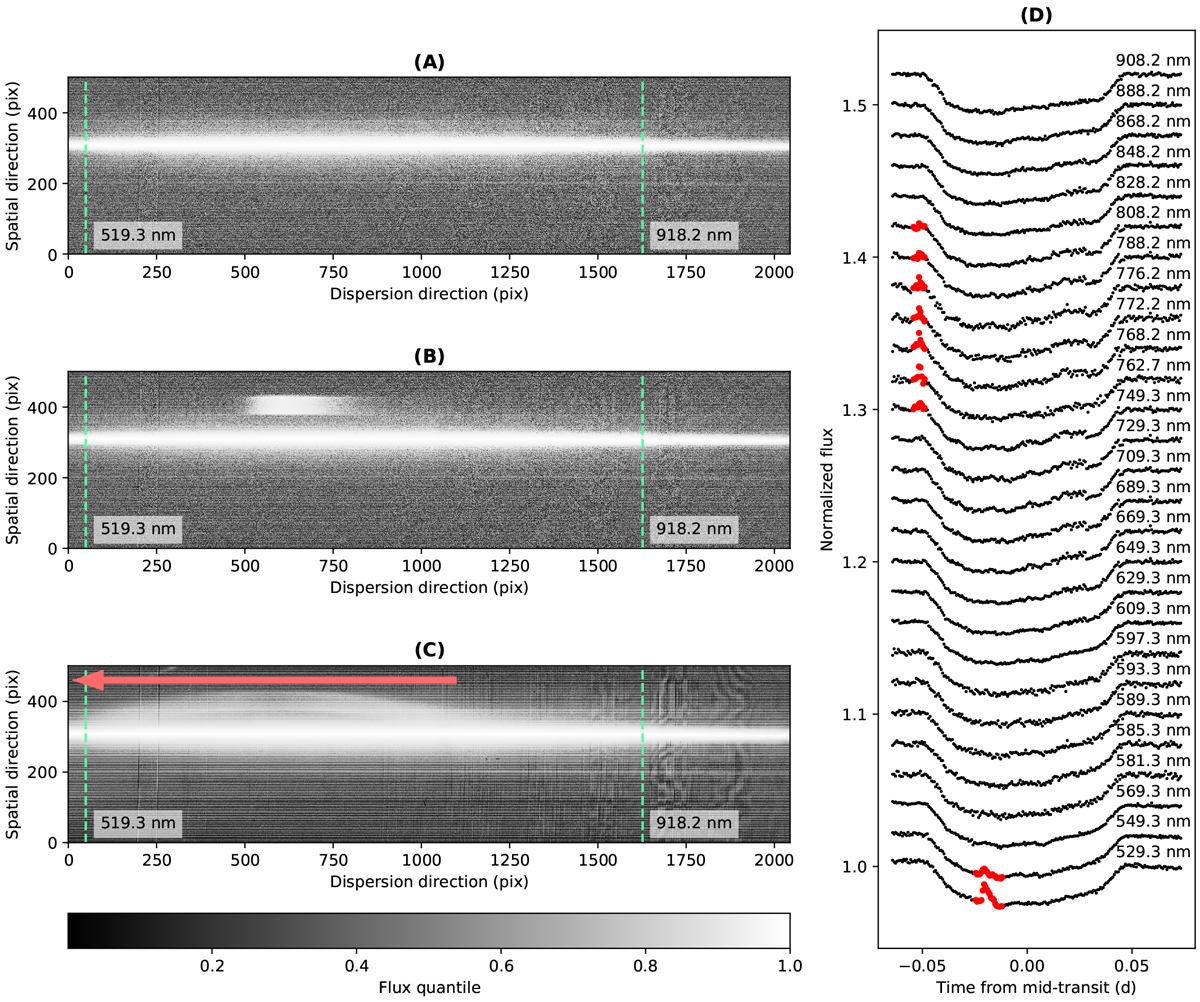
Fig. A.1
Download original image
Moving ghost contaminating the spectral images of OB12. Panel A: a clear frame near the mid-transit. Panel B: a contaminated frame near the ingress of the transit. Panel C: stacking all contaminated frames showing the trace of ghost. The green dashed lines indicate the waveband for white-light curves. The red arrow indicates the moving direction of the ghostfrom the redder side to the bluer side. Panel D: raw spectroscopic light curves used in Sect. 3.2. The red dots correspond to the contaminated frames, which were removed in the spectroscopic light curve fitting. We note that the horizontal moire fringes shown in Panel A, B, and C were caused by the 500-kHz fast readout mode adopted in OB12 and were visually magnified due to a small figure size, which barely affected the stellar fluxes.
Current usage metrics show cumulative count of Article Views (full-text article views including HTML views, PDF and ePub downloads, according to the available data) and Abstracts Views on Vision4Press platform.
Data correspond to usage on the plateform after 2015. The current usage metrics is available 48-96 hours after online publication and is updated daily on week days.
Initial download of the metrics may take a while.