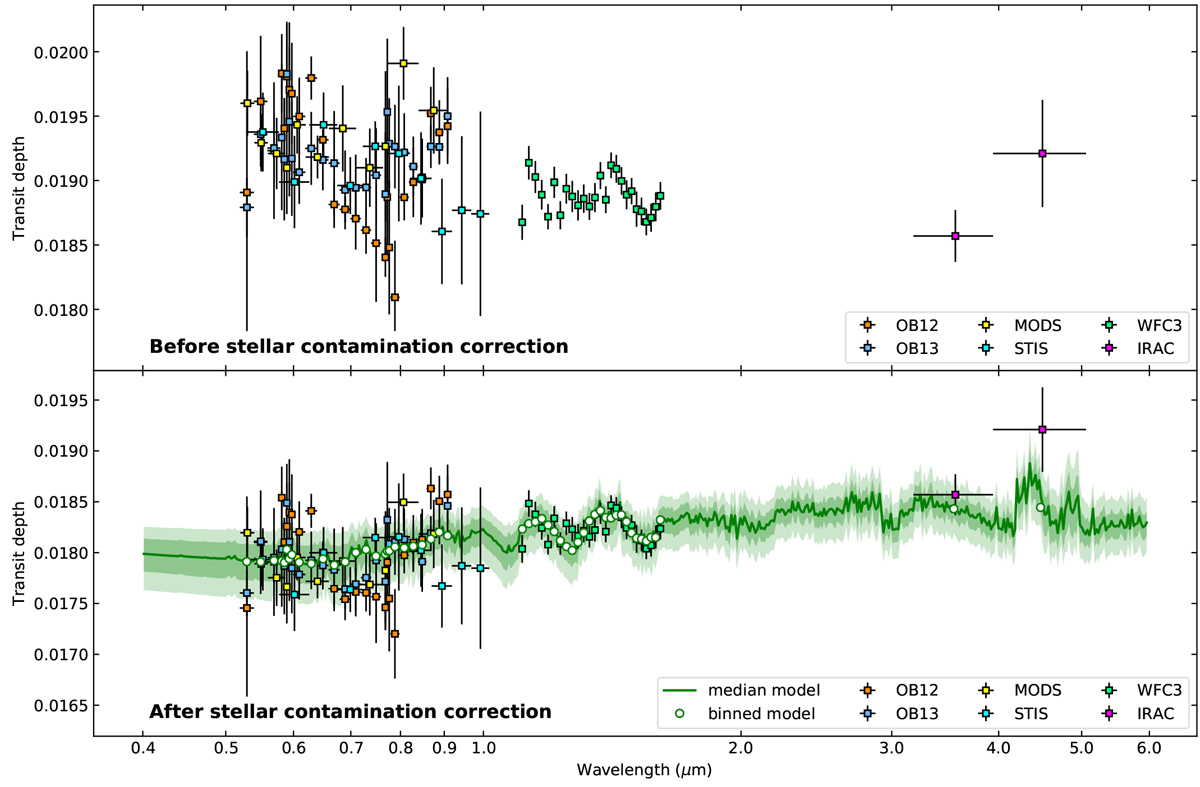
Fig. 8

Download original image
Retrieval analysis joint with the transit depths presented in Yan et al. (2020) (LBT MODS) and Wong et al. (2020) (HST STIS G750; HST WFC3 G141; Spitzer IRAC). Upper panel: raw transmission spectra of the six data sets. Lower panel: shows the joint fit results with the effects of stellar contamination corrected for each data set. The green solid line is the median model with a resolution of λ∕Δλ = 200. The shaded areas indicate 68 and 95% credible intervals. The white dots are best-fit values calculated at the same wavelength bins as the corresponding data points. In the range of 0.5–1.0 μm, only the best-fit points corresponding to OSIRIS wavebands are displayed for clarity.
Current usage metrics show cumulative count of Article Views (full-text article views including HTML views, PDF and ePub downloads, according to the available data) and Abstracts Views on Vision4Press platform.
Data correspond to usage on the plateform after 2015. The current usage metrics is available 48-96 hours after online publication and is updated daily on week days.
Initial download of the metrics may take a while.


