Fig. 6
Download original image
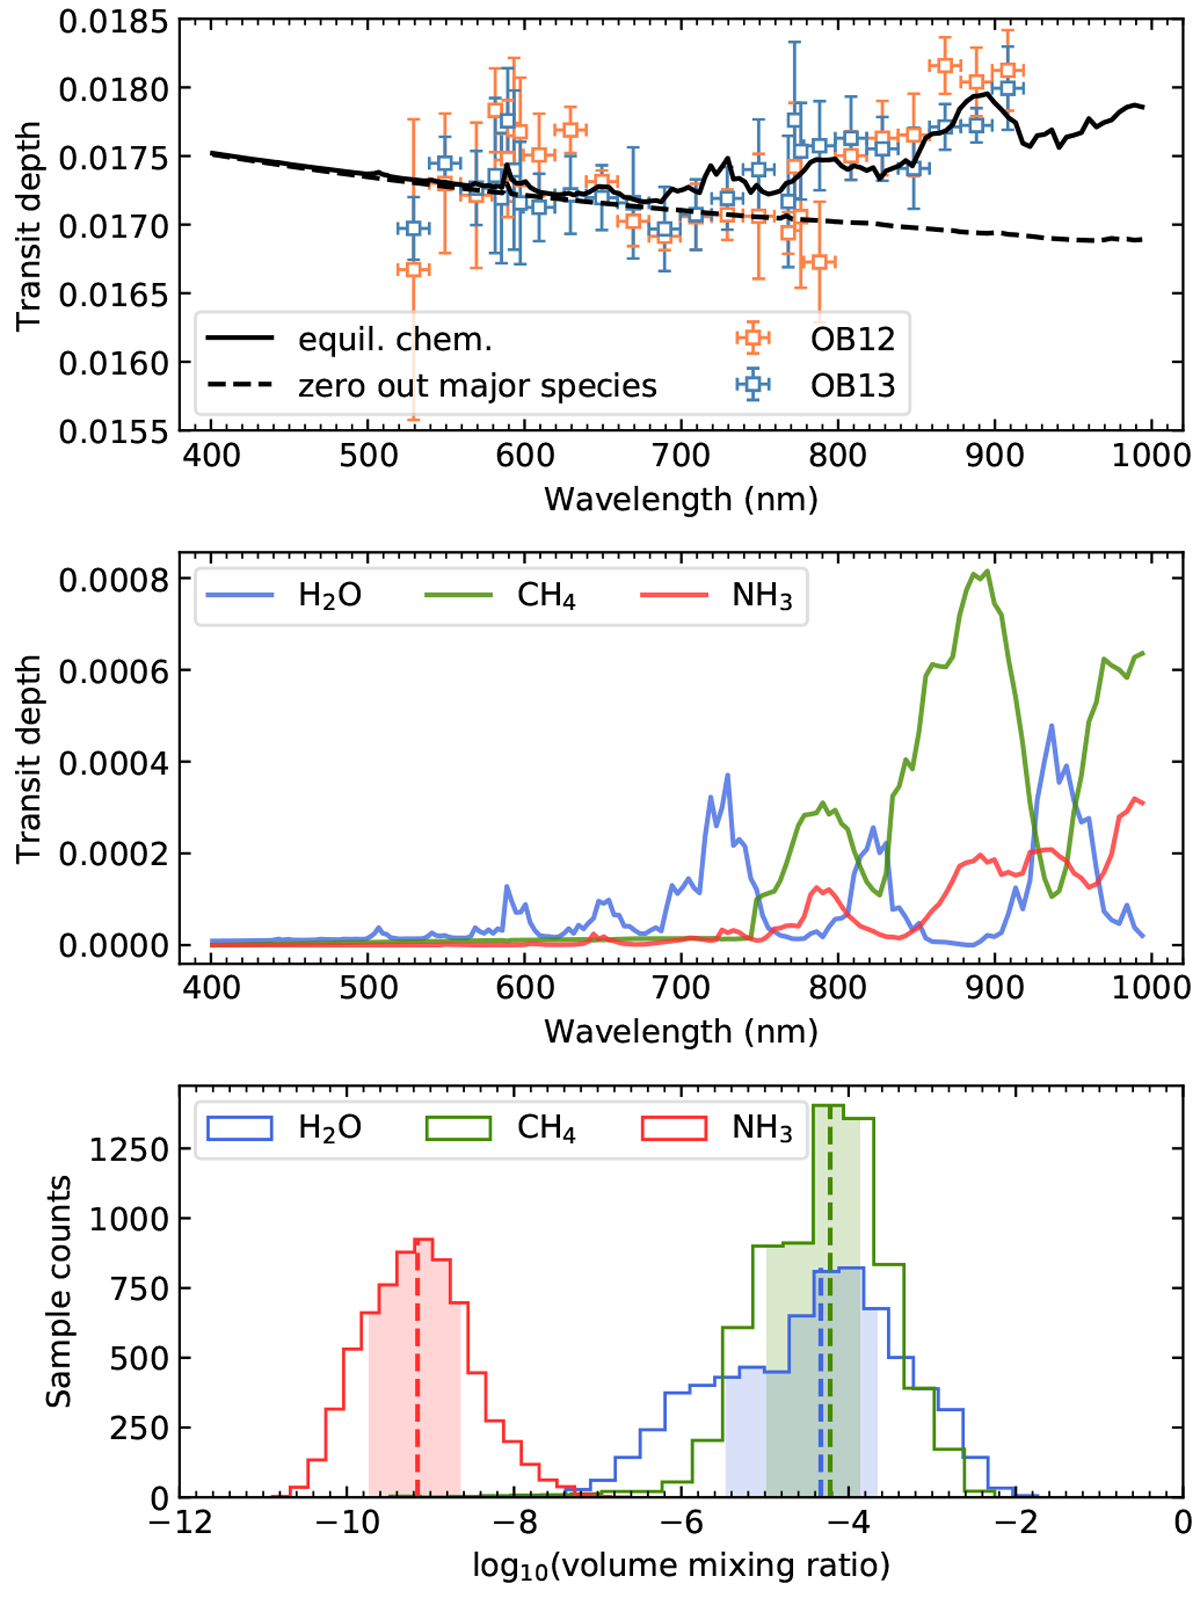
Major chemical species contributing to gas absorption features. Top panel: solid line is the median model shown in the lower panel of Fig. 5. The dashed line is the same atmospheric model but assuming zero abundance of H2O, CH4, and NH3. The transmission spectra of OB12 and OB13 have been corrected for stellar contamination. Middle panel: contributions of gas absorption to the transmission spectra. Bottom panel: posterior distributions of the major species’ volume mixing ratios.
Current usage metrics show cumulative count of Article Views (full-text article views including HTML views, PDF and ePub downloads, according to the available data) and Abstracts Views on Vision4Press platform.
Data correspond to usage on the plateform after 2015. The current usage metrics is available 48-96 hours after online publication and is updated daily on week days.
Initial download of the metrics may take a while.