Fig. 2
Download original image
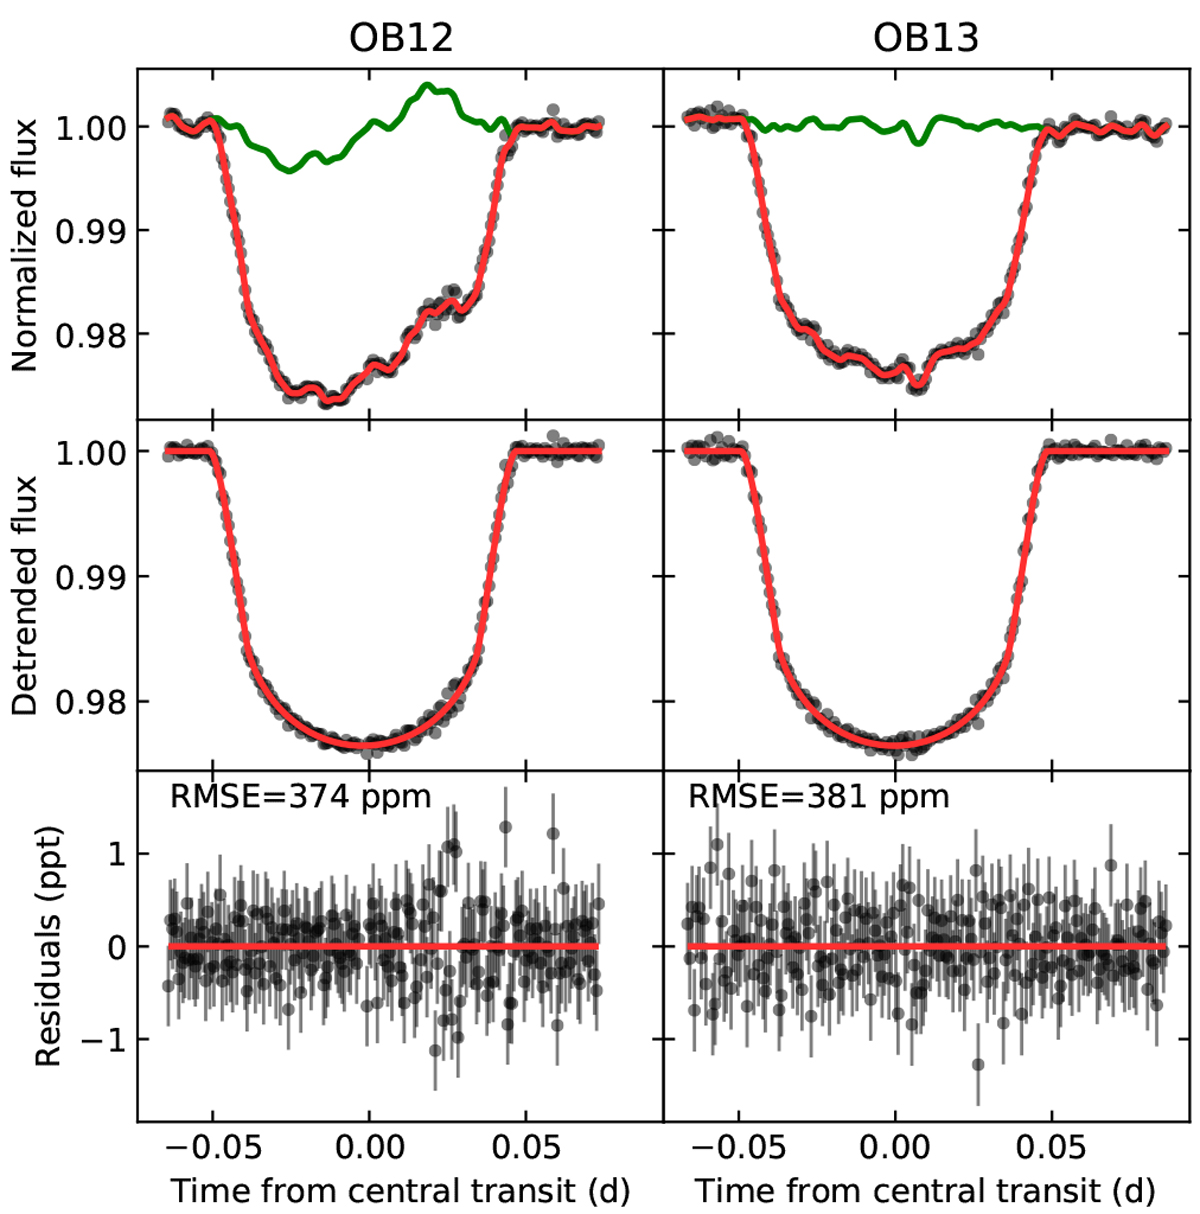
Joint white-light curve fitting of OB12 (left column) and OB13 (right column). Top panels: observed white-light curves (black dots), along with the best-fit curves (red lines) and systematics (green lines). Mid panels: detrended white-light curves (black dots) and the best-fit transit models (red lines). Bottom panels: residuals of light-curve fitting.
Current usage metrics show cumulative count of Article Views (full-text article views including HTML views, PDF and ePub downloads, according to the available data) and Abstracts Views on Vision4Press platform.
Data correspond to usage on the plateform after 2015. The current usage metrics is available 48-96 hours after online publication and is updated daily on week days.
Initial download of the metrics may take a while.