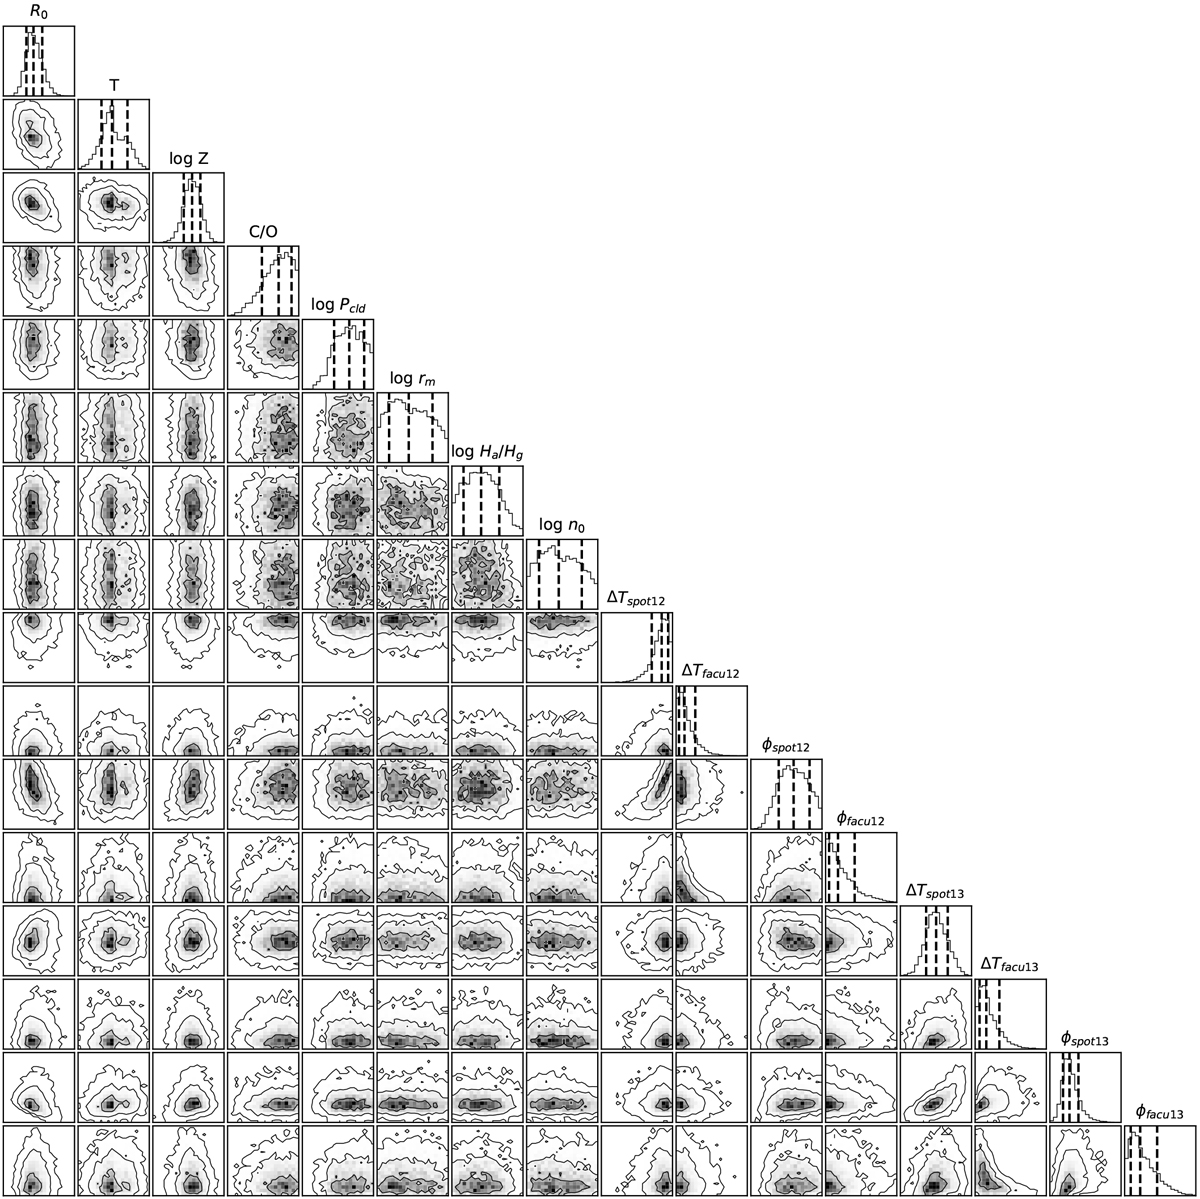
Fig. A.6
Download original image
Posterior joint distributions of parameters for atmospheric retrieval. The contours indicate 39.3%, 86.5%, 98.9% (1- to 3-σ) credible intervals. The diagonal panels show the marginal distributions of corresponding parameters, in which the vertical dashed lines indicate the medians and 68.2% credible intervals. The specific values of posteriors are listed in Table 4. This figure is plotted utilizing the Python package corner (Foreman-Mackey 2016).
Current usage metrics show cumulative count of Article Views (full-text article views including HTML views, PDF and ePub downloads, according to the available data) and Abstracts Views on Vision4Press platform.
Data correspond to usage on the plateform after 2015. The current usage metrics is available 48-96 hours after online publication and is updated daily on week days.
Initial download of the metrics may take a while.