Fig. A.5
Download original image
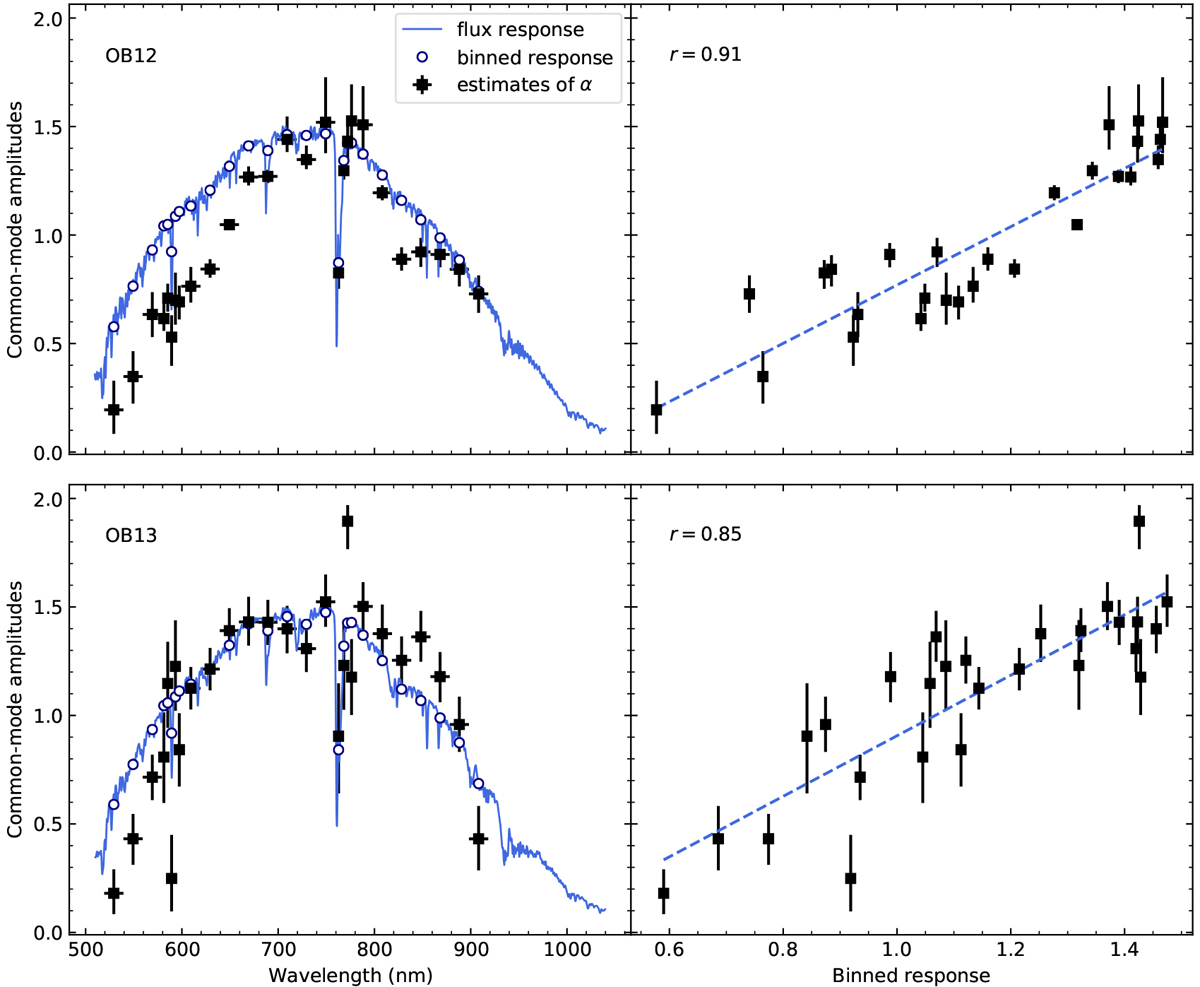
Flux-correlated amplitudes of common modes. The upper and lower panels correspond to the results of OB12 and OB13, respectively. Left panels: comparison between the common-mode amplitudes and flux response curves. Right panels: correlation between the common-mode amplitudes and binned flux responses. The blue dashed lines are linear regression models. The Pearson correlation coefficient is denoted as r. The flux response curves were arbitrarily rescaled for clarity but would not affect the correlation.
Current usage metrics show cumulative count of Article Views (full-text article views including HTML views, PDF and ePub downloads, according to the available data) and Abstracts Views on Vision4Press platform.
Data correspond to usage on the plateform after 2015. The current usage metrics is available 48-96 hours after online publication and is updated daily on week days.
Initial download of the metrics may take a while.