Fig. A.2
Download original image
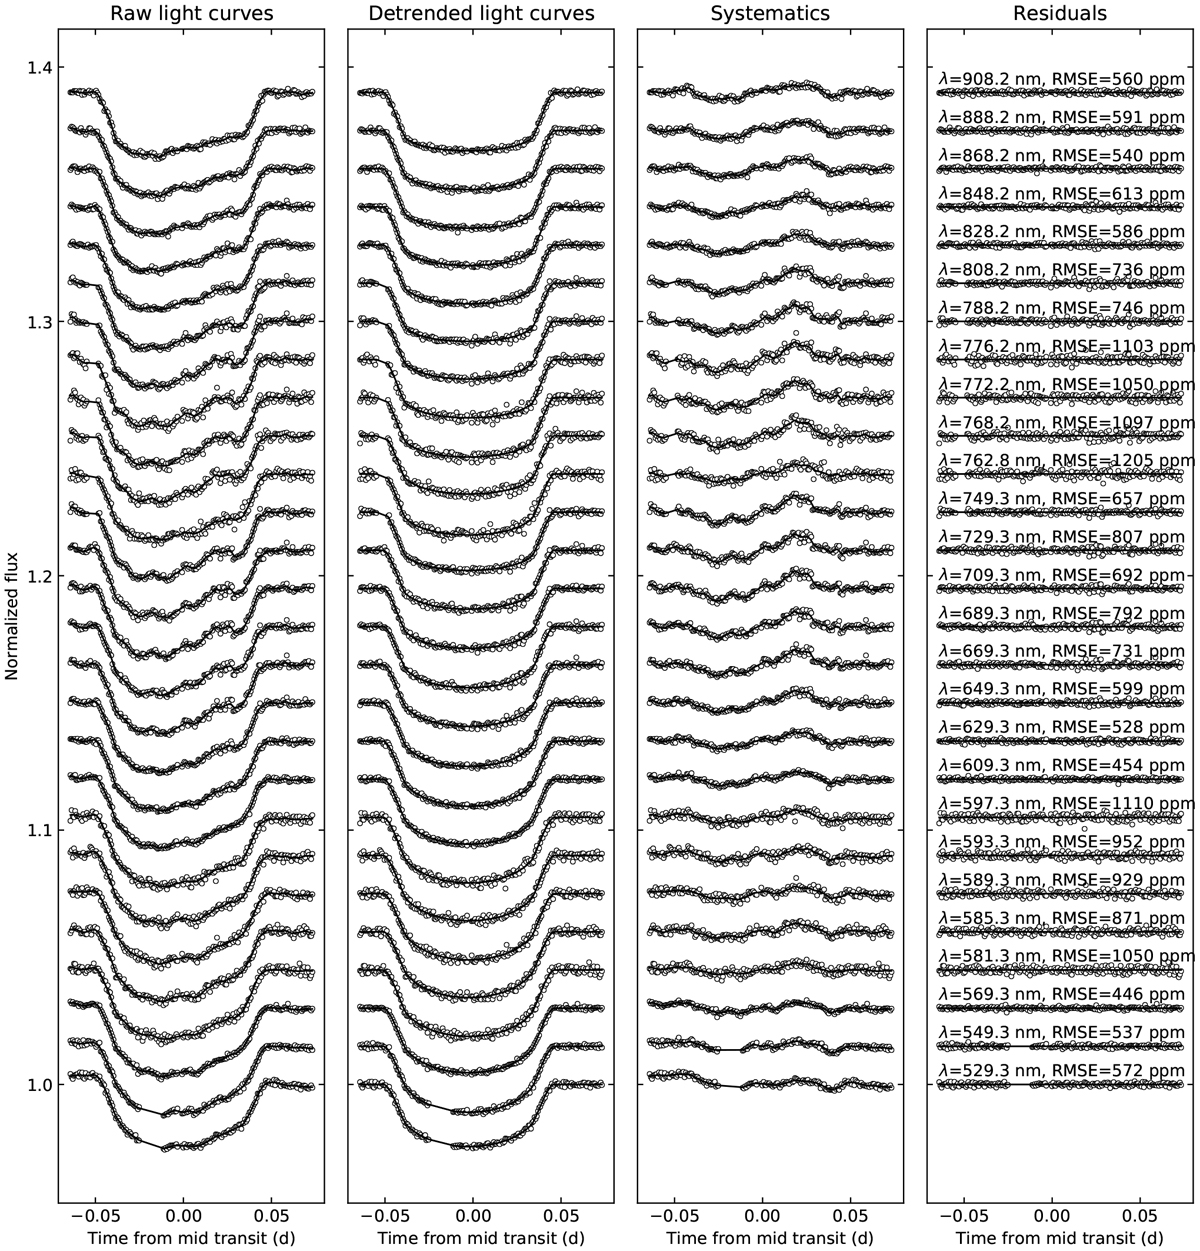
Spectroscopic light curve fitting of OB12. From left to right, the first panel: the raw light curves (circles) and the best-fit curves (solid lines); the second panel: the detrended light curves (circles) and the best-fit transit models (solid lines);the third panel: the extracted systematics (circles) and their GP models (solid lines); the fourth panel: the residuals. The points affected by the moving ghost have been removed. The curves were arbitrarily shifted for clarity.
Current usage metrics show cumulative count of Article Views (full-text article views including HTML views, PDF and ePub downloads, according to the available data) and Abstracts Views on Vision4Press platform.
Data correspond to usage on the plateform after 2015. The current usage metrics is available 48-96 hours after online publication and is updated daily on week days.
Initial download of the metrics may take a while.