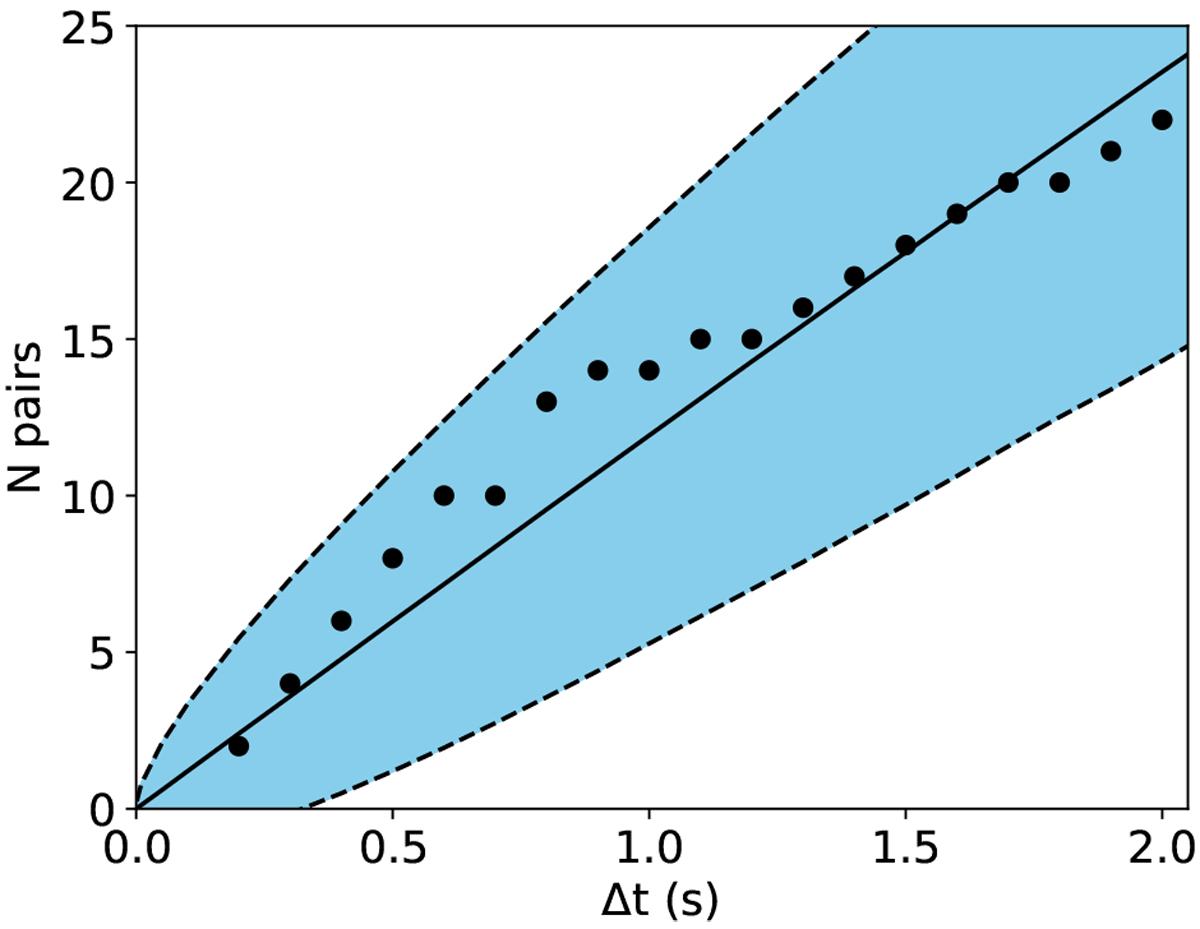
Fig. 4
Download original image
Total number of pairs with delay smaller than Δt. The solid line corresponds to the mean value from the Monte Carlo simulation and the blue area with dashed margins defines the 95% interval of coincidence. The black dots represent the observed count of pairs. The hypothesis that the excess of observed pair counts is a result of chance cannot be ruled out.
Current usage metrics show cumulative count of Article Views (full-text article views including HTML views, PDF and ePub downloads, according to the available data) and Abstracts Views on Vision4Press platform.
Data correspond to usage on the plateform after 2015. The current usage metrics is available 48-96 hours after online publication and is updated daily on week days.
Initial download of the metrics may take a while.