Fig. 3
Download original image
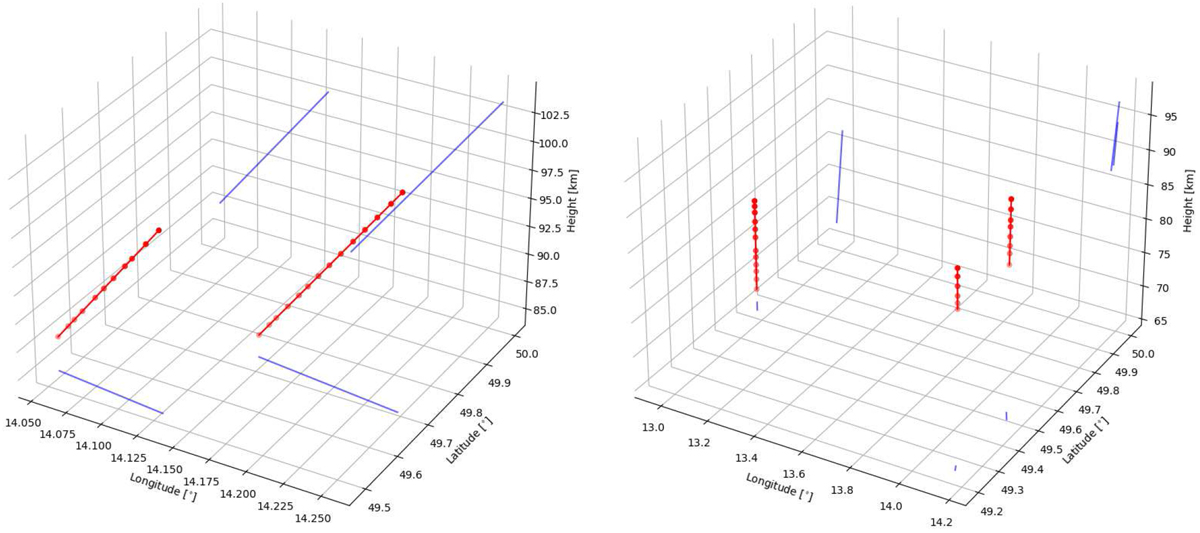
Three-dimensional map of the atmospheric trajectories (red dots) of a close pair 069–070 (plot A, meteor 069 on the right and 070 on the left) and a triplet 06C13260A, 06C13260B, and 06C13261 (plot B, meteor 260A on the right, 260B in the middle, 261 on the left) and their horizontal and vertical projections (blue lines). The x-axis represents the geographic longitude, the y-axis the geographic latitude, and the z-axis the height. Each red dot shows the position of the meteor at a given video frame. The time between one dot and the next is 0.04 s.
Current usage metrics show cumulative count of Article Views (full-text article views including HTML views, PDF and ePub downloads, according to the available data) and Abstracts Views on Vision4Press platform.
Data correspond to usage on the plateform after 2015. The current usage metrics is available 48-96 hours after online publication and is updated daily on week days.
Initial download of the metrics may take a while.