Free Access
Fig. 1
Download original image
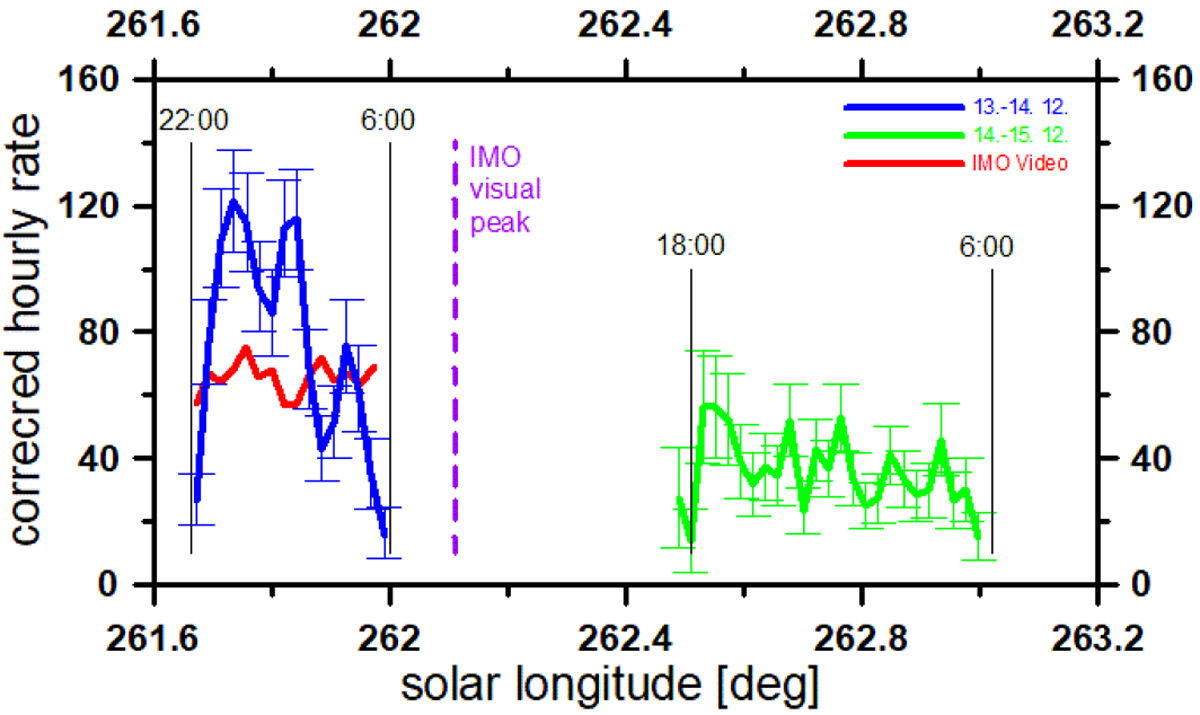
Activity of the 2006 Geminid meteor shower determined using the video cameras from December 13 to December 15. The dashed violet line represents the peak determined by IMO VMDB, the thin black lines the time (UT). The red line shows the activity profile derived by the IMO Video Meteor Network.
Current usage metrics show cumulative count of Article Views (full-text article views including HTML views, PDF and ePub downloads, according to the available data) and Abstracts Views on Vision4Press platform.
Data correspond to usage on the plateform after 2015. The current usage metrics is available 48-96 hours after online publication and is updated daily on week days.
Initial download of the metrics may take a while.