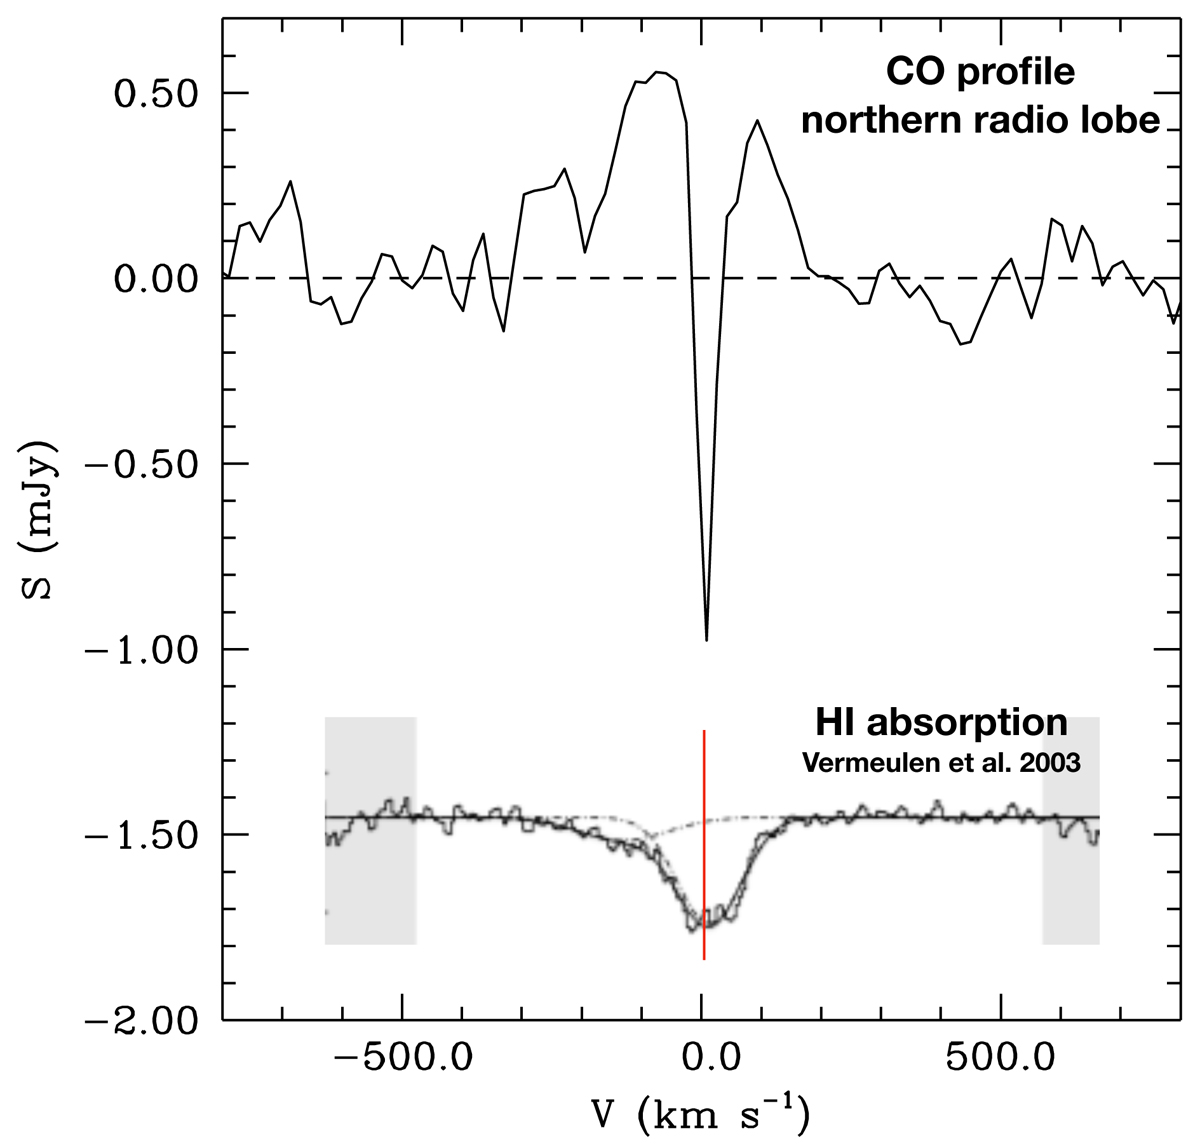
Fig. 9.
Download original image
Comparison between the CO profile at the location of the northern lobe (from the lower-resolution cube) and the H I absorption profile from Vermeulen et al. (2003). This illustrates the similarity of the velocity widths between the CO emission and the H I absorption. The scales on the y-axis of the two plots are different. The regions marked in grey in the H I plots were affected by radio frequency interference (see Vermeulen et al. 2003 for the full discussion).
Current usage metrics show cumulative count of Article Views (full-text article views including HTML views, PDF and ePub downloads, according to the available data) and Abstracts Views on Vision4Press platform.
Data correspond to usage on the plateform after 2015. The current usage metrics is available 48-96 hours after online publication and is updated daily on week days.
Initial download of the metrics may take a while.