Fig. 6.
Download original image
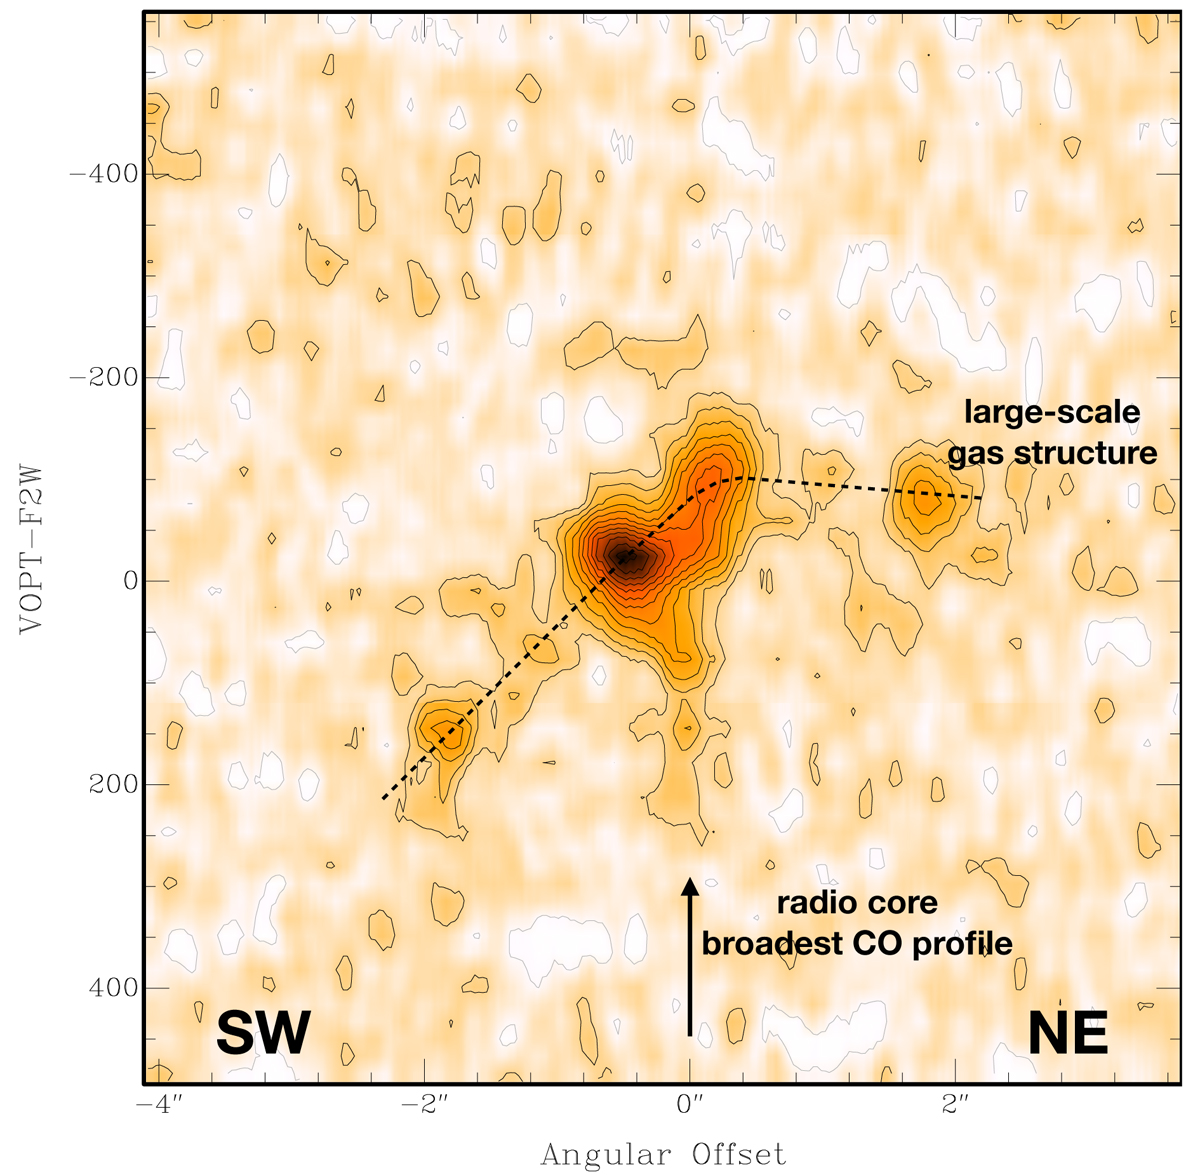
Position-velocity plot of the CO(2–1) obtained from a cut taken perpendicular to the radio axis and passing through the core (PA = 52°). On the larger scales, the emission shows the overall velocity gradient of the CO and shows the high velocity dispersion gas redshifted compared to the systemic velocity at the location of the core as a separate component. Contour levels: −0.18, 0.18–2 mJy beam−1 in steps of 0.18 mJy beam−1.
Current usage metrics show cumulative count of Article Views (full-text article views including HTML views, PDF and ePub downloads, according to the available data) and Abstracts Views on Vision4Press platform.
Data correspond to usage on the plateform after 2015. The current usage metrics is available 48-96 hours after online publication and is updated daily on week days.
Initial download of the metrics may take a while.