Fig. 5.
Download original image
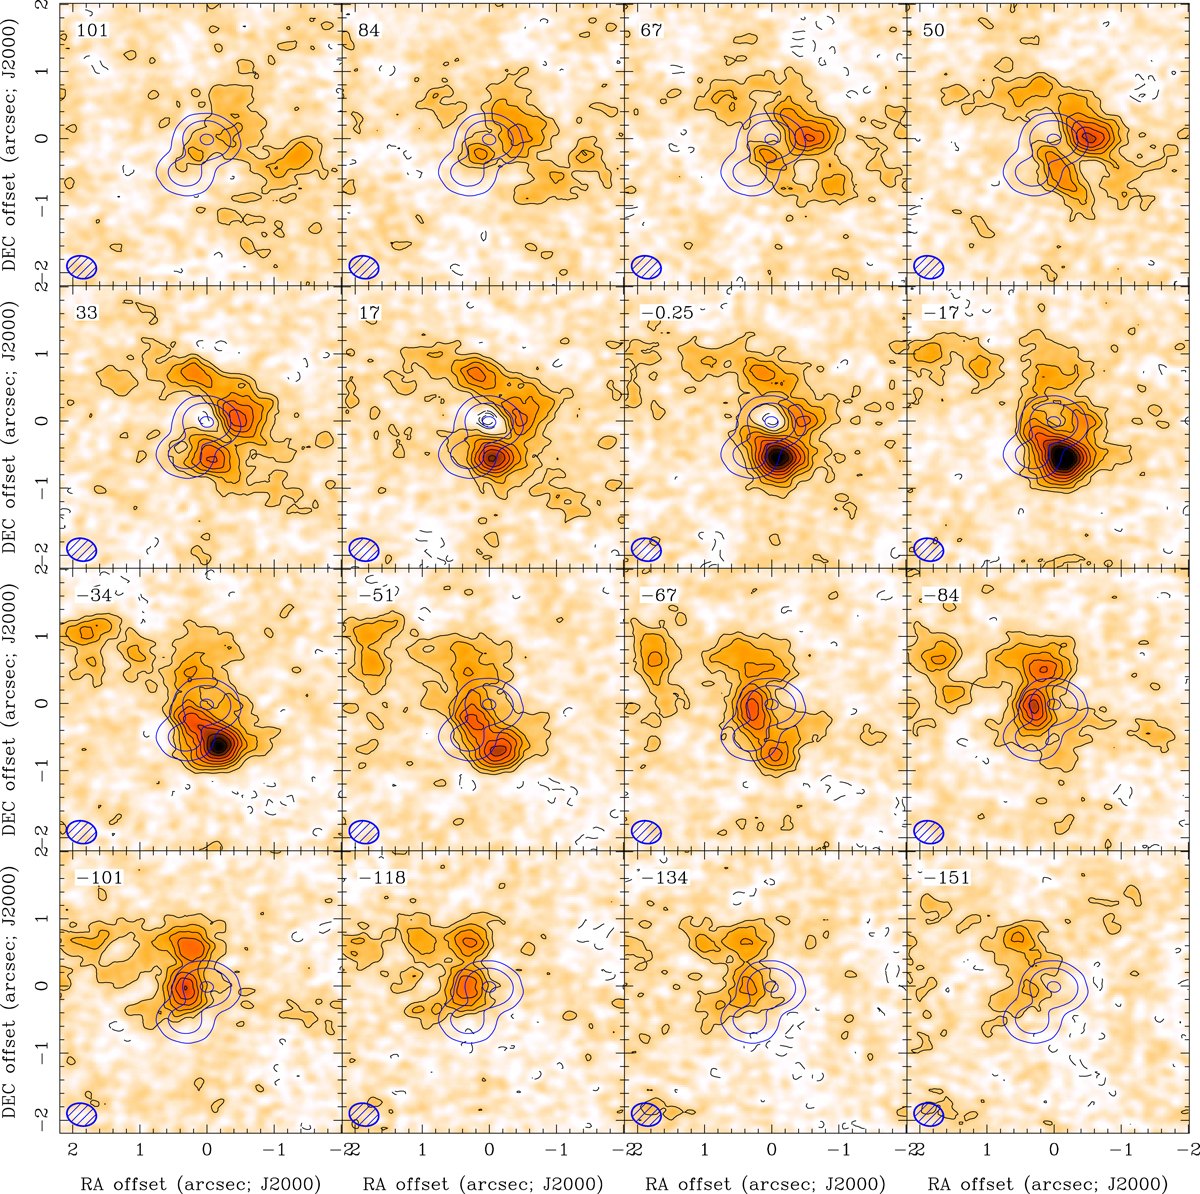
Channel maps of the CO(2–1) emission (from the natural weighting cube) in orange and black contours superposed to the continuum emission (at the same spatial resolution) in purple. Contour levels for the line emission are −0.24, 0.24 to 2.64 mJy beam−1 in steps of 0.24 mJy beam−1 and 4, 20, and 100 mJy beam−1 for the continuum. These plots illustrate how the gas is seen preferentially located around the lobes. In the central location, the emission is seen in multiple plots, confirming the high velocity dispersion (as shown in Fig. 6).
Current usage metrics show cumulative count of Article Views (full-text article views including HTML views, PDF and ePub downloads, according to the available data) and Abstracts Views on Vision4Press platform.
Data correspond to usage on the plateform after 2015. The current usage metrics is available 48-96 hours after online publication and is updated daily on week days.
Initial download of the metrics may take a while.