Fig. 4.
Download original image
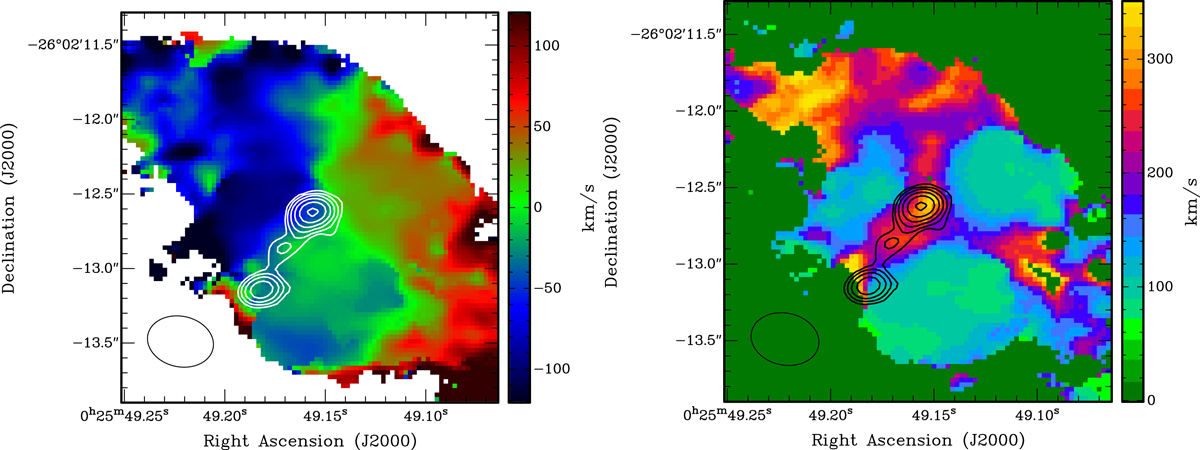
Left: velocity field of the CO(2–1) with superposed the contours of the radio continuum emission. The overall velocity show a smooth gradient throughout the emission, although it is clear that the kinematics of the gas is complex. Contour levels are 1.3, 2.6, 5.2, 10.4, 20.8, and 41.6 mJy beam−1. Right: line width (FWHM) in colour with superposed the contours of the radio continuum emission. Contour levels are 1.3, 2.6, 5.2, 10.4, 20.8, and 41.6 mJy beam−1. A region of high FWHM of the CO(2–1) line is clearly seen co-spatial with the radio continuum emission. In the northern region, the high velocity dispersion is the result of multiple stream of gas and multiple components of the velocity profile as can be seen in Fig. 7 region D.
Current usage metrics show cumulative count of Article Views (full-text article views including HTML views, PDF and ePub downloads, according to the available data) and Abstracts Views on Vision4Press platform.
Data correspond to usage on the plateform after 2015. The current usage metrics is available 48-96 hours after online publication and is updated daily on week days.
Initial download of the metrics may take a while.